A line chart shows data changes in time on a general scale. It is suitable for showing trends of data change with equal intervals.
A line chart shows each data element as a point, the vertical coordinate of which is proportional to the element value. If there are several data groups, the points corresponding to one data series are connected with a broken line.
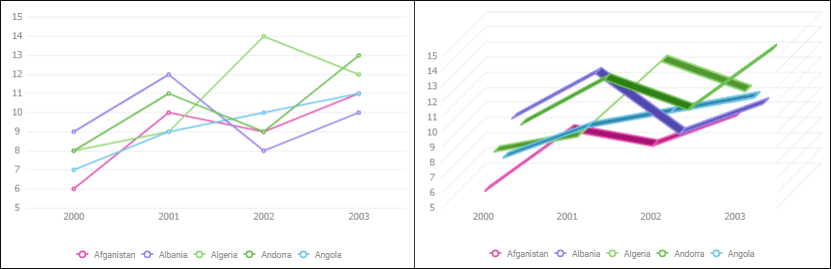
The example of a line chart with absolute values and a 3D line chart:
Available line chart types:
 absolute values.
 stacked.
 percentage.
 absolute values 3D.
 stacked 3D.
 percentage 3D.
The following settings are available during chart editing:
See also:
Chart Types | Data Visualization as Charts