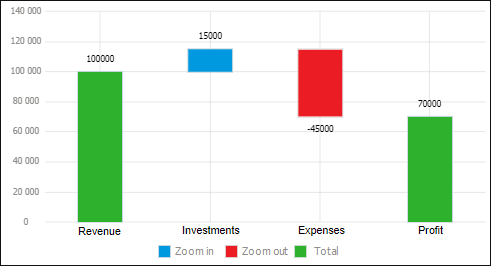
A waterfall chart shows changes in series points in comparison with the previous point value.
Each series point is displayed as a vertical or horizontal column, which length is proportional to point value. The first column is always built from zero, the second column is built from the first value down, if the value is negative, or up, if the value is positive, and so on. The chart legend contains predefined names: Zoom in, Zoom out, and Total.
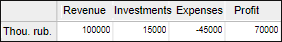
To show the example of the waterfall chart, use the Financial Results Indicators, ths. rub.:
Showing waterfall chart built on the source data:
The following settings are available during chart editing:
See also:
Chart Types | Data Visualization as Charts