An area chart shows dimension size depending on the time and can be used to highlight the total value according to trend.
In area chart, vertical segments are drawn proportionally to values of all data elements for each data group. The points corresponding to one set of different groups, are connected with a broken line. The area under the broken line is filled with the color set for this data element.
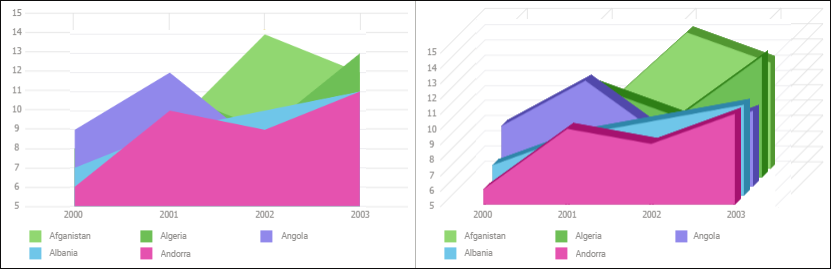
The example of an area chart with absolute values and a 3D area chart:
Available area chart types:
 absolute values.
 stacked.
 percentage.
 absolute values 3D.
 stacked 3D.
 percentage 3D.
The following settings are available during chart editing:
See also:
Chart Types | Data Visualization as Charts