A scatter chart is used to show and compare number values: scientific, statistical, technical data.
On a scatter chart, value of each dimension element is displayed as a point on Cartesian coordinate system. Each dimension has individual set of points which is marked with specific color in legend.
The number of dimensions displayed in scatter chart is two and more.
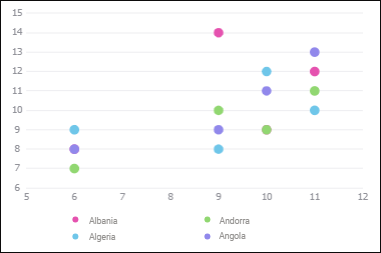
The example of scatter chart:
The following settings are available during chart editing:
See also:
Chart Types | Data Visualization as Charts