Use the ribbon. Click the ![]() Type button on the Chart ribbon tab.
Type button on the Chart ribbon tab.
To change chart type:
Use the ribbon. Click the ![]() Type button on the Chart ribbon tab.
Type button on the Chart ribbon tab.
Use the Chart side panel tab.
Use the Chart Type dialog box.


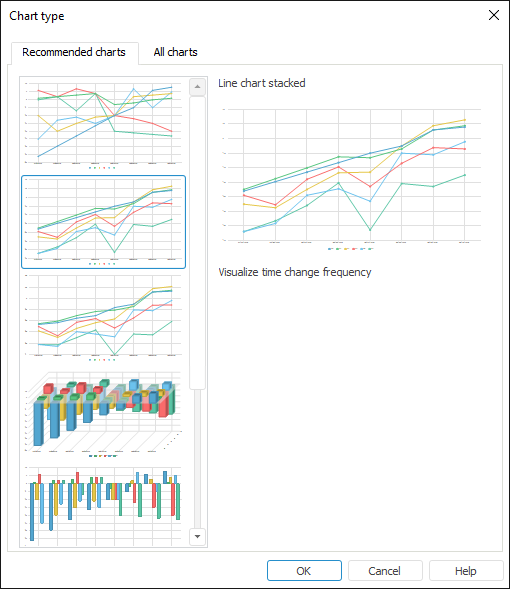
The Recommended Charts tab contains most appropriate chart types for selected data. The appropriate charts are selected based on the source data, available dimensions and selection in them.
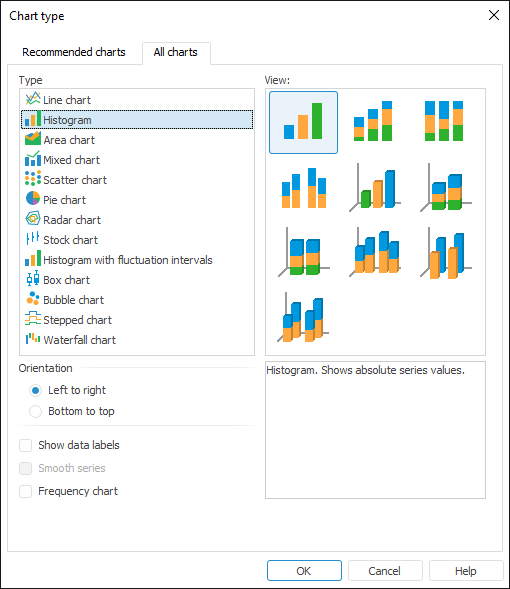
The All Charts tab contains all chart types and advanced settings are available.
NOTE. On changing chart type the previously configured binding of series to secondary axis is saved for all chart types, except for the histogram with grouping and the stock exchange chart with the opening rate.
Available settings depending on the chart type:
 Transform chart into frequency one
See also: