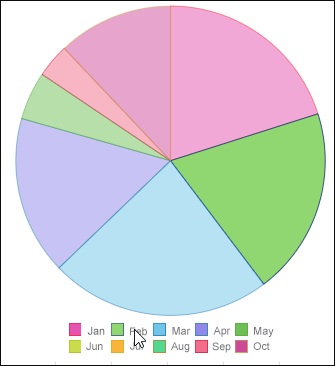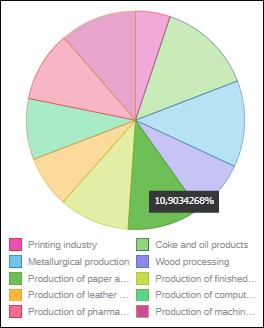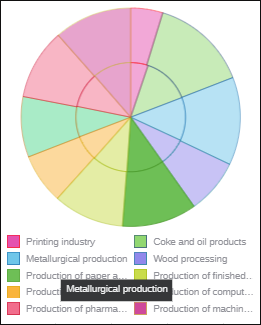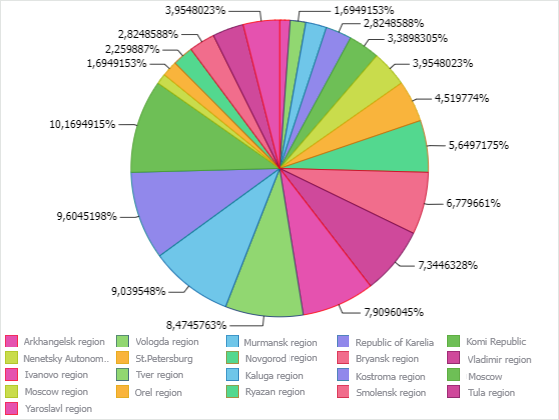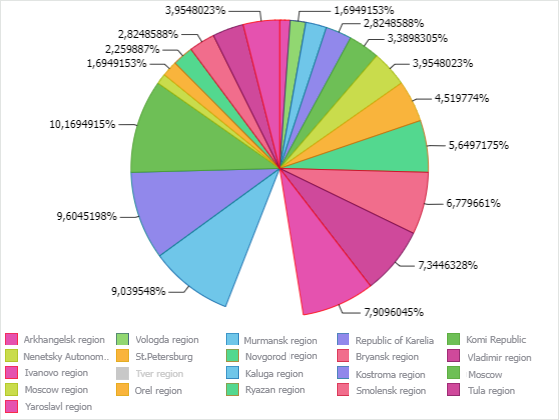
A chart is a means of visual displaying table data and is used to graphically present data.
A chart consists of a set of elements. Each element has a specific set of parameters.
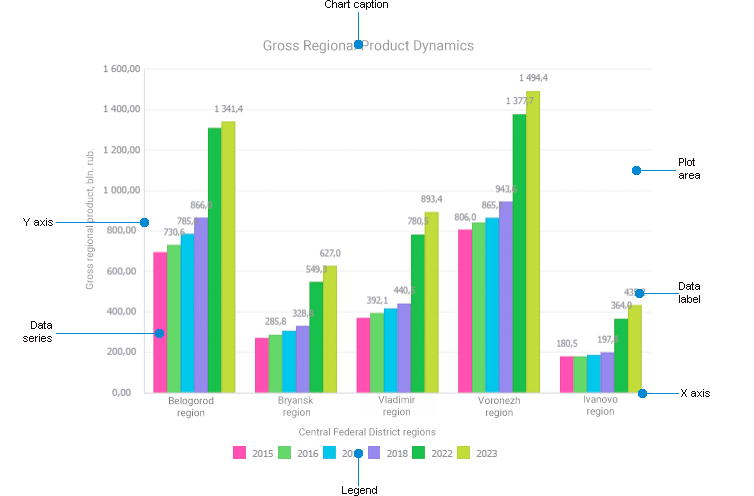
Chart elements:
Chart area. It includes all chart elements.
Axes. They are used to arrange data in a chart.
Plot area. It includes chart data series.
Data series. It contains a set of values that are used to plot a chart.
Caption. It contains short description of chart contents.
Data labels. They contain information about series or specific data points.
Legend. It contains names and data markers in a chart.
A chart retains a connection to data, that is, any change in table data results in rerendering the chart taking into account these changes.
To create a chart, execute one of the operations:
Using Drag&Drop:
Hover the cursor over the required source/slice. The cursor will change to  .
.
Drag the source/slice to the working area. The top left border of the selected cell will be the left top border of a table or a chart built based on the created slice.
NOTE. When the source is dragged to the working area, a new slice is added automatically.
In the selection menu specify  Chart> <Chart type>.
Using context menu:
Select an empty cell on a report sheet. The top left border of the selected cell will be the left top border of a table or a chart built based on the required data slice.
Execute one of the operations:
Select the Add > Chart > <Chart type> item in the data source's context menu on the Sources panel. A new data slice will be created for the data source, based on which a chart will be plotted on a report sheet.
Select the Add > Chart > <Chart type> item in the data slice's context menu on the Sources panel.
Select the Add Chart > <Chart type> item in the table's context menu on the Sources panel.
NOTE. When a chart is added in the table's context menu, it will be plotted above the selected table.
After executing one of the operations:
The selected chart type will be added to the sheet.
A chart named Chart N will be added to the Source panel, where N - chart number.
The Source Data group of parameters is opened on the side panel.
 Set up chart general properties
To work with charts as objects on a report sheet, see the Working with Objects on Report Sheet article.
View chart data series highlighting
View chart data series tooltips
Series data drilldown and drillup
Exclude from and include series in chart with saving dimension selection
See also:
Data Visualization on Report Sheet