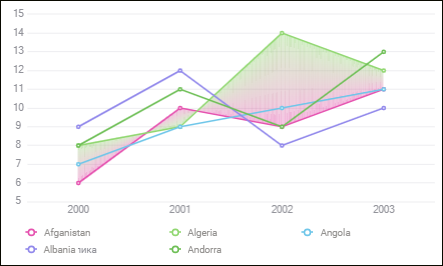
A chart corridor is a selected part of plot area located between two line chart series. Multiple corridors can be created.
The example of a corridor with two-color gradient fill:
To set up line chart corridor parameters, use the Chart Corridors group of parameters on the side panel.
 Open the Chart Corridors group of parameters
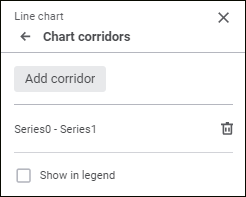
Open the corridor settings panel, click the Add Corridor button to add a new corridor or double-click the existing corridor to edit it:
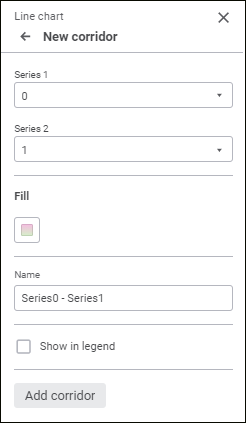
Set the parameters:
Series. Select the first and the second corridor series in the Series 1 and Series 2 drop-down lists.
Fill. In the drop-down palette select corridor fill method:
Solid Fill. Go to the One Color tab and select corridor solid fill color. If required, specify fill opacity percent.
Two-Color Fill. Default value. Go to the Two Colors tab and select start and end colors of two-color gradient. If required, specify fill opacity percent.
One can select standard and custom colors. The palette contains only standard colors by default. To create a custom color, use the advanced color palette that is available after clicking the  Add Color button. The maximum possible number of custom colors in the palette is 23. To delete custom color from the palette, select the Delete item in the selected color's context menu.
Name. Set a corridor name to be shown in a legend.
Show in Legend. Select the checkbox to show a corridor in a legend.
Click the Add Corridor button to save new corridor settings and add it to the chart.
NOTE. When the existing corridor is edited, the Add Corridor button is disabled. Changed corridor settings are saved automatically.
To delete the corridor, hover the cursor over it and click the  Delete button.
See also:

 Parameters button on the toolbar, then select the required group.