Tooltips
A tooltip shows necessary information about a data series point and level line in the legend on mouseover.
NOTE. Displaying of tooltips for data series in the legend is available for all charts, except doughnut charts and waterfall charts.
The example of a tooltip:
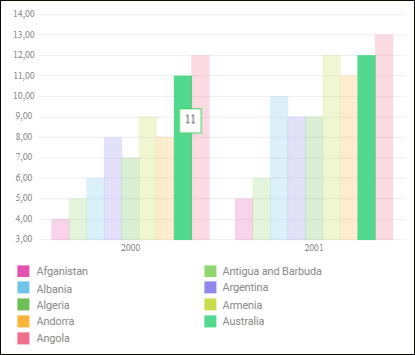
To set up tooltip parameters, use the Tooltips group of parameters on the side panel.
 Open the Tooltips group of parameters

 Parameters button on the toolbar, then select the required group.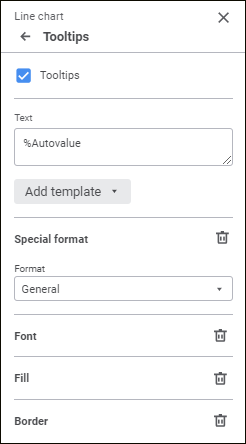
Select the Tooltips checkbox to show tooltips on the chart and set the parameters:
Text
A custom text, template or a combination of both can be set for tooltips. To enter text and templates, use the Text box.
To add a template to the label text:
Click the Add Template button.
In the drop-down list select one of the available text templates.
After executing the operations the selected template will be added to label text after the cursor.
Available templates:
%PointNo. Point number.
%PointName. Point name.
%SerieNo. Series number.
%SerieName. Series name.
%PercentPartHundredth. Cumulative shares.
%PercentPart. Percentage cumulative shares.
%PercentHundredth. Shares are the ratio of the point value to the sum of values of this point over all the series.
%Percent. Percent shares are ratio of the series point value to sum of values for this point in all series, shown as a percentage.
%Part. Cumulative value.
%YValue. Y axis point value.
%XValue. X axis point value.
%Value. Point value.
%Autovalue. Default value. Automatic value format.
NOTE. Tooltip text is determined automatically for level lines.
Special Format
Select format of displayed values in the Format drop-down list.
Depending on the selected format, advanced value display settings are available:
When the Number, Currency, Percentage or Exponential value format is selected, the Decimal Places box becomes available, in which determine the number of displayed decimal places using the value editor or the keyboard.
When the Number or Currency value format is selected, the Negative Numbers drop-down list becomes available, in which select the required negative number display option.
When the Currency value format is selected, the Symbol drop-down list becomes available, in which select the required currency.
When the Number value format is selected, the Thousands Separator checkbox becomes available. If required, select it to separate digit groups.
When the Data, Time, or Additional value format is selected, the Type drop-down list becomes available, in which select the required type of displaying values of the selected format.
When the Custom value format is selected, the Type box becomes available, in which select the proper method of displaying values.
To reset formatting settings, click the  Delete button.
Font
Set font options:
Font. Select one of the available fonts in the drop-down list. If required, one can load custom fonts.
Font Size. Select the required font size. Size is set in points, it can be selected in the drop-down list or entered using the keyboard. The range of available values: [8; 36].
Color. Select font color in the drop-down palette. One can select standard and custom colors. The palette contains only standard colors by default. To create a custom color, use the advanced color palette that is available after clicking the
 Add Color button. The maximum possible number of custom colors in the palette is 23. To delete custom color from the palette, select the Delete item in the selected color's context menu.
Font Style. Select font style:
B. Bold.
I. Italic.
U. Underline.
When the button is pressed, the corresponding font style is used. Several styles can be used simultaneously, for example, pressed B and I buttons result in bold italic font style.
To reset font options, click the Delete button.
Fill
In the drop-down palette select tooltip background fill method:
Solid Fill. Default value. Select solid color for tooltip background fill. If required, specify fill opacity percent.
One can select standard and custom colors. The palette contains only standard colors by default. To create a custom color, use the advanced color palette that is available after clicking the Add Color button. The maximum possible number of custom colors in the palette is 23. To delete custom color from the palette, select the Delete item in the selected color's context menu.
No Fill. Tooltip background fill will not be used. Click the
 No Color button.
To reset fill settings, click the Delete button.
Border
To set up tooltip area border, set the parameters:
Line Type. Select line type in the drop-down list.
Line Color. Select line color in the drop-down palette. One can select standard and custom colors. The palette contains only standard colors by default. To create a custom color, use the advanced color palette that is available after clicking the
Add Color button. The maximum possible number of custom colors in the palette is 23. To delete custom color from the palette, select the Delete item in the selected color's context menu.
NOTE. Line color setup is available only when the Indicator Color checkbox is deselected.
Line Width. Set the required line width using the keyboard or the value editor.
When the Indicator Color checkbox is selected, tooltip area border color matches with the color of the area, for which a tooltip is displayed. The checkbox is selected by default.
To reset border settings, click the Delete button.