Plot Area
A plot area is part of chart area, which contains data series.
To set up chart plot area parameters, use the Plot Area group of parameters on the side panel.
NOTE. The setting is available for all chart types, except pie charts.
 Open the Plot Area group of parameters

 Parameters button on the toolbar, then select the required group.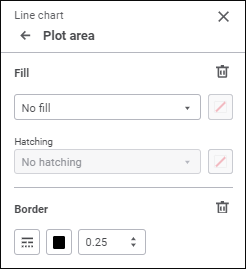
Set the parameters:
Fill
To set up plot area background, select fill type in the drop-down list:
No Fill. Default value. Fill is not used.
Solid Fill. Select solid fill color for the plot area in the drop-down palette. If required, specify fill opacity percent.
Two-Color Fill. Select the start and the end colors of two-color gradient in the drop-down palette. If required, specify tilt angle and fill opacity percent.
Alternating Colors. In the drop-down palette select the first and the second colors that will alternate from bottom to top starting with the first color. If required, specify fill opacity percent.
Hatching Fill. Execute the operations:
Select solid fill color in the drop-down palette. If required, specify fill color and hatching color transparency percent.
Select texture option in the Hatching drop-down list.
Select hatching color in the drop-down color palette.
One can select standard and custom colors in the drop-down palette. The palette contains only standard colors by default. To create a custom color, use the advanced color palette that is available after clicking the  Add Color button. The maximum possible number of custom colors in the palette is 23. To delete custom color from the palette, select the Delete item in the selected color's context menu.
To reset fill settings, click the  Delete button.
Border
To set up plot area border, set:
Line Type. Select line type in the drop-down list.
Line Color. Select line color in the drop-down palette. One can select standard and custom colors. The palette contains only standard colors by default. To create a custom color, use the advanced color palette that is available after clicking the
Add Color button. The maximum possible number of custom colors in the palette is 23. To delete custom color from the palette, select the Delete item in the selected color's context menu.
Line Width. Set the required line width using the keyboard or the value editor.
To reset border settings, click the Delete button.