A radar chart enables the user to compare statistical values of several data series.
A radar chart shows all categories with their own coordinate axes that radiate as beams from the coordinate origin. Values that belong to one series are connected with lines.
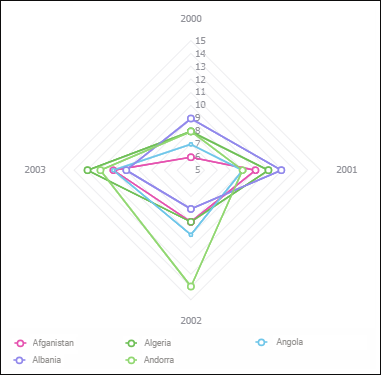
The example of radar chart:
The following settings are available during chart editing:
See also:
Chart Types | Data Visualization as Charts