
 To add a map to report sheet
A map is based on a two-dimension table and usually consists of one row or column from this table as territory filling. Territory filling is determined by start and end colors, which correspond to minimum and maximum values on the map. Intermediate value colors are calculated automatically.
NOTE. Before working with a map, make sure that the requirements for working with a map are met.
Main features of a map:
Working in 3D mode.
Displaying timeline and map animation playback.
Connecting external map services.
Flexible setup of color legend, height legend and tooltips.
Territory fill based on various metrics, and other features.
A detailed description of features is given in the Setting Up Map section.
In the Reports tool, maps can be used more widely in comparison with other tools of Foresight Analytics Platform. Map features in regular report:
Adding the indicators that are used to display information, and also setting up their attributes.
Simplified creating of arrows between territories.
Creating of territory info.
Advanced setup of map legend.
Setting up label format of territories.
Setting up handler for map events.
Changing map structure.
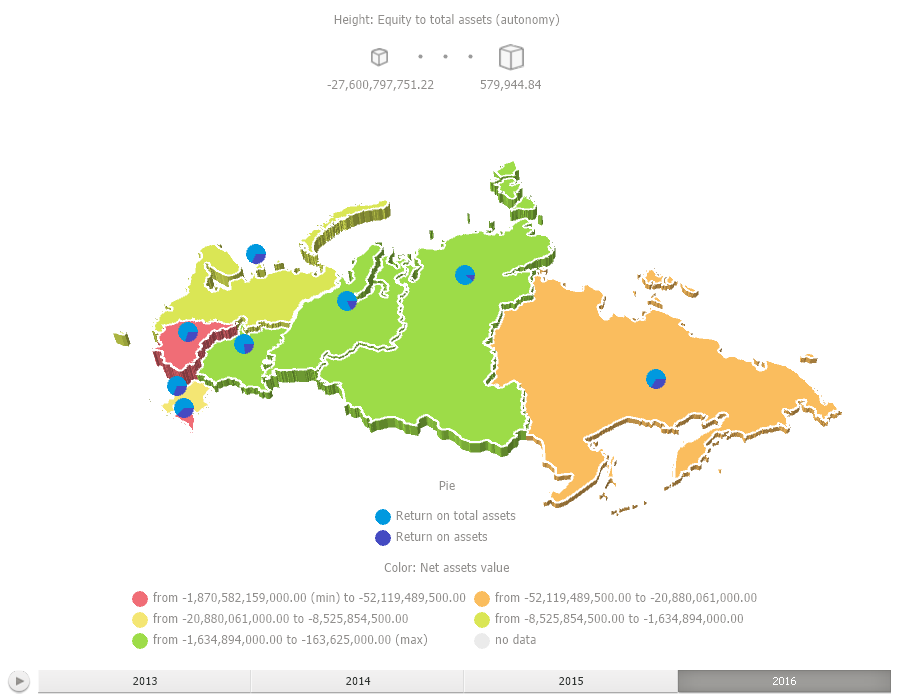
The example of a map:
See also:
Getting Started with the Reports Tools in the Web Application | Data Visualization on Report Sheet