 Create a variable
Variables are used to get source data and to load calculation results.
To work with variables, enable the Schema view in the data view area.
To create a variable:
Double-click the data view area.
Click the ![]() Variable button on the Home ribbon tab.
Variable button on the Home ribbon tab.
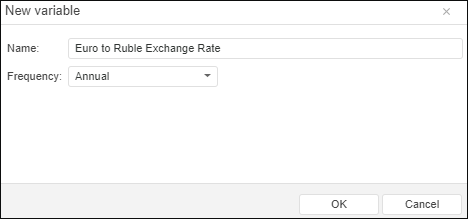
A variable creation dialog box opens, in which determine name and calendar frequency for the created variable:

The variable is added to the data view area.

 Add a variable from data source
To add a variable from a data source:
Enable displaying of the series tree.
Select a data source. Available series are displayed in the tree.
Drag the series from the series tree to the data view area.
To open a variable with particular key:
Open the browser.
In the address bar specify the Modeling and Forecasting tool URL in the web application. The unit address is created as follows: <web application URL>/model.html.
For example: http://biserver/FP_App_v10.x/app/model.html, where http://biserver/FP_App_v10.x/app is the web application URL.
Add the key special parameter to the address and specify the model key. Then add the entry special parameter and specify the variable key. URL format: <tool URL>#key=<model key>&entry=<variable key>. If it is required to open several variables, determine their keys via comma.
For example: http://biserver/FP_App_v10.x/app/model.html#key=11111&entry=12345,67890, where 11111 is the model key, 12345 and 67890 are keys of variables to be opened.
Go to the formed URL.
The model that contains variables is displayed in the working area. The opened variable is selected.
If the model or variable with the specified key is not found, an appropriate message appears. The model and variables are searched in the repository determined in the PP.xml file for the web application in use.
To view variable parameters, use the Primary tab on the side panel.
Data can be edited on the following tabs of the results panel:
Table. Enter the required values to the data table.
Graphs. Editing order:
Enable data editing. Press the ![]() Enable Editing button.
Enable Editing button.
Select edit mode and change data. To select the mode, use the drop-down menu of the ![]() Enable Editing button:
Enable Editing button:
Edit by Points. Each point of the variable is edited separately.
Select a variable in the legend or in the chart using the mouse. The graph highlights all the points available for editing. Hover the cursor over a variable point (the cursor changes to a double-headed arrow), hold down the mouse button and drag the point to the new position. The current value of the point is displayed next to the point.
Edit by Drawing. Several variable points are edited in a single move.
Select a variable in the legend using the mouse. The graph highlights all the points available for editing. Hover the cursor over a variable point (variable background by value axis is highlighted), hold down the mouse button and drag the point to a new position. Editing of neighboring points can be continued without releasing the button. The current value of the edited point is displayed next to the point.
After editing save changed data. If the data was not saved and edited variable lost focus, it is prompted to save changed data.
To save changed data, click the ![]() Save Changes button on the Graphs or Table tab of the results panel.
Save Changes button on the Graphs or Table tab of the results panel.
To undo changes in unsaved data, click the ![]() Undo Changes button on the Graphs or Table tab on the results panel.
Undo Changes button on the Graphs or Table tab on the results panel.
To rename the variable:
Use the data view area:
Double-click on the variable. Its name opens in the edit mode.
Change the name. Press the ENTER key or click outside the data view area.
Use the Primary tab on the side panel.

 Set up parameters of variable name forming
To set up parameters of variable name forming, use the Variables group in the Parameters dialog box. To open the dialog box, select the Tools > Parameters main menu item. The item is available if a model is opened in the working area.

To show in the variable name:
Variable data source name. Select the Show Source in Name checkbox. The option is relevant if the variable is added from data source.
Data source name is added to the beginning of the variable name and is separated from it with exclamation mark. Example: Socio-Economic Indicators!World|TOUIRISM|Data of Russian Federal State Statistics Service.
Variable calendar frequency name. Select the Show Frequency in Name checkbox and specify the format of calendar frequency displaying in the drop-down list:
One Symbol. The calendar frequency abbreviation is displayed in the variable name:
A. Annual.
S. Semi-annual.
Q. Quarterly.
M. Monthly.
D. Daily.
Full Name. The full name of calendar frequency is displayed in the variable name.
The calendar frequency type is added to the end of the variable name and is separated from it by the vertical bar. For example: Euro against Ruble exchange rate|A, Dollar against Euro exchange rate|Quarterly.
To exclude from the variable name:
Variable data source name. Deselect the Show Source in Name checkbox.
Variable calendar frequency name. Deselect the Show Frequency in Name checkbox.
To visualize data:
Select one or several variables in the working area.
Click the  Chart button on the Home ribbon tab.
Data of the selected variables is displayed as a chart in the working area. For example:

If scenario modeling is used, the line does not display data by all variable scenarios.
To visualize a secondary variable on the current line:
Select the required variable in the working area.
Point the mouse cursor to the center of the variable. The cursor should change to ![]() .
.
Hold down the mouse button and move the cursor to the current chart in the working area. If a link can be established, the chart is highlighted, and the link is shown as a bold dashed line.
Release the mouse button.
The selected variable is added to visualizer.
To delete a visualizer chart, select it in the working area and then:
Press the DELETE key.
Click the ![]() Delete button on the Home ribbon tab.
Delete button on the Home ribbon tab.
A confirmation dialog box opens.
To delete the variable from the visualizer chart, select the link between the variable and visualizer chart, and then:
Press the DELETE key.
Click the ![]() Delete button on the Home ribbon tab.
Delete button on the Home ribbon tab.
A confirmation dialog box opens. If the last variable is deleted from the visualizer chart, the visualizer itself is deleted too.
To filter data of all variables contained in the working area, use the ![]() Filter button on the Home ribbon tab. Select the filter mode in the drop-down menu of the button:
Filter button on the Home ribbon tab. Select the filter mode in the drop-down menu of the button:
Hide All Empty Columns. It hides all empty columns in the table.
Hide All Empty Columns Before Start/After End Periods. It hides all empty columns in the table to the left and to the right from the time series.
To disable filtering, release the ![]() Filter button or set the None radio button in the drop-down menu of this button.
Filter button or set the None radio button in the drop-down menu of this button.

 Calculate descriptive statistics of variable
Descriptive statistics are a wide set of data analysis methods that enable the user to find dependencies between variables, determine direction of this dependency, and calculate various summary statistics.
To calculate descriptive statistics, select one or more variables in the data view area. Calculation results are displayed on the Descriptive Statistics tab on the results panel.

 Calculate correlation dependency of variables
To calculate correlation matrix, select some variables in the data view area. Calculation results are displayed on the Correlation Matrix tab on the results panel.

 Execute autocorrelation analysis
To execute autocorrelation analysis of a variable and to get autocorrelation and particular autocorrelation functions, select:
A variable, which does not is not used in calculation.
Input variable of the equation, in which the input variable is not the output one.
Analysis results are displayed on the ACF and PACF tab of the results panel.

 Execute additional operations with variables
Additional operations are available on working with variables, included into the equation or used in descriptive statistics calculation.
Additional operations are:
Setting variable lag.
Quick transformation of variable data.
Creating a copy of the variable inside the equation/calculation of descriptive statistics.
Deleting the variable from the equation/calculation of descriptive statistics.
If the additional operations are available for the variable, the ![]() button is displayed next to it. Clicking the button opens the menu that contains operation commands.
button is displayed next to it. Clicking the button opens the menu that contains operation commands.
Variable key is unique and is used to precisely identify the variable in the modeling container.
To get variable key:
Open the model that contains the variable.
Select the variable. To get keys of several variables, select several variables.
Go to the browser address bar.
The variable key is shown in the web application address after the entry special parameter. If several variables are selected, their keys are specified via comma. For example: http://biserver/FP_App_v10.x/app/model.html#key=11111&entry=12345, where 12345 is the variable key.
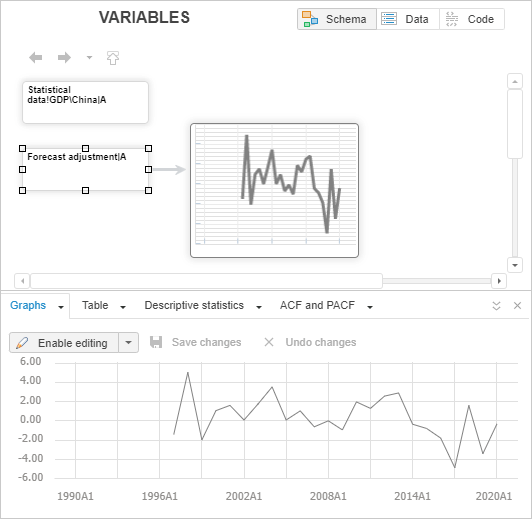
Example of working area with modeling variables:

See also: