The series tree displays a tree-like structure of elements of the opened data source. It is used to add variables to a model. Time series databases are available as data sources.
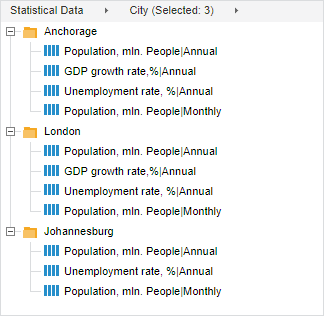
The example of a series tree:
The tree structure is based on attribute sequence defined in the breadcrumb. Levels of tree hierarchy are shown as folders, which names match the attribute values. Multiple elements can be selected in the tree if the user holds down the SHIFT or CTRL keys.
The breadcrumb is shown under the series tree. The user can work with it after selecting a data source. The first element displayed in the breadcrumb is the name of the time series database that is used as a data source, then its attributes are displayed. After attribute order in the breadcrumb changes, the series tree hierarchy is rebuilt. If the breadcrumb does not contain the selected attributes, the elements are shown as a list.
 Open data source or attribute menu in breadcrumb
Add an attribute to breadcrumb
Replace attribute in breadcrumb
Use sequence of default attributes in data source
Remove attribute from breadcrumb
Filter series tree by attribute values
Change names of elements in the attribute values list
See also:
