
 To display the tab
The Correlation Matrix tab shows values of correlation coefficients and a scatter chart of variable dependencies.
For example:
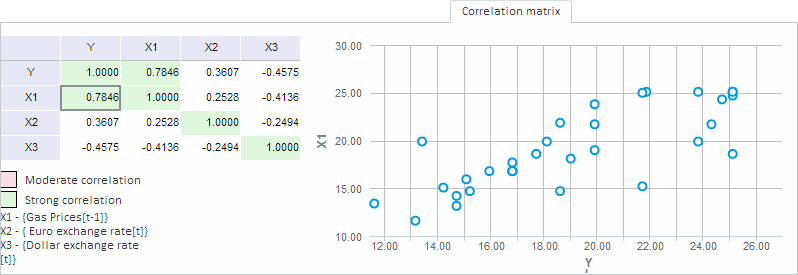
Table cells with the output values are filled with the corresponding colors:
Pink. Moderate correlation. The absolute value of the correlation coefficient is between 0.5 and 0.75.
Green. Strong correlation. The value of the correlation coefficient is in the range by absolute value from 0.75 and greater.
The dependency chart is built for variables, which correlation coefficient is selected in the table.
If a correlation matrix is calculated for variables, which are not input in any equation, additional calculation parameters are available:
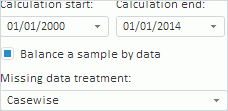
Calculation Start. Specify start date of correlation coefficient calculation.
Calculation End. Specify end date of correlation coefficient calculation.
Balance a Sample by Data. Specify, by which observations the correlation coefficient is calculated. The checkbox is selected by default, and all observations on the special point are excluded, if there is missing data on this point at least in one variable. If the checkbox is selected, the correlation coefficients are calculated by all available data.
NOTE. The parameter is relevant if the Casewise method is used as the missing data treatment method.
Missing Data Treatment. Specify the missing data treatment in variables. Detailed description of available missing data treatment methods is given in the Missing Data Treatment section.
See also: