In this article:
Excel
The Excel connector is an object that is used to get data from Microsoft Excel (*.xls or *.xlsx) file. To import data from Microsoft Excel file in the 64-bit operating system, Foresight Analytics Platform and Microsoft Office must have the same bitness.
NOTE. Data import from large Excel files may require more virtual memory use. To avoid it, transfer data from the Excel file to the text file and use the Text connector.
After adding the connector to the ETL task working area, set basic properties and import options. The connector output can also be edited and data filtering options can be set.
Import Options
The Import Options page is used to specify a file with imported data and parameters that are used to determine a data range.
Specify the imported Microsoft Excel file in the File box. Click the Browse button to select a file.
Depending on the file format and its driver, a different set of settings is available:

 XLSX files
If the Request File on Task Execution checkbox is selected, the dialog box for selecting a Microsoft Excel file opens on executing an ETL task. The checkbox is deselected by default, working is executed with the file that is specified in the File box.
To determine advanced settings used on data identification, click the Advanced Settings button. The Advanced Settings dialog box opens. To preview data, selected by query, click the View Data button.
NOTE. After import options are specified, file structure must not change. If the file is requested several times and the task is used several times to load data from different files, then the files structure must be the same and correspond to the file used on the first connector setting in ETL task.
Crosstab
A crosstab is a summary table, in which headers can be located both by rows and columns allowing to display relation between two or more variables.
If the Crosstab checkbox is selected, additional pages are available that are used to determine settings of data identification in the crosstab:
Crosstab Structure.
Set Up Crosstab.
Crosstab Structure
A crosstab is a summary table, in which headers can be located both by rows and columns allowing to display relation between two or more variables.
To set up crosstab structure for selected import provider:
Click the Settings button on the Import Options page.
Select the Crosstab checkbox in the dialog box that opens.
Go to the Crosstab Structure page opened in the Excel data provider creating and editing wizard:
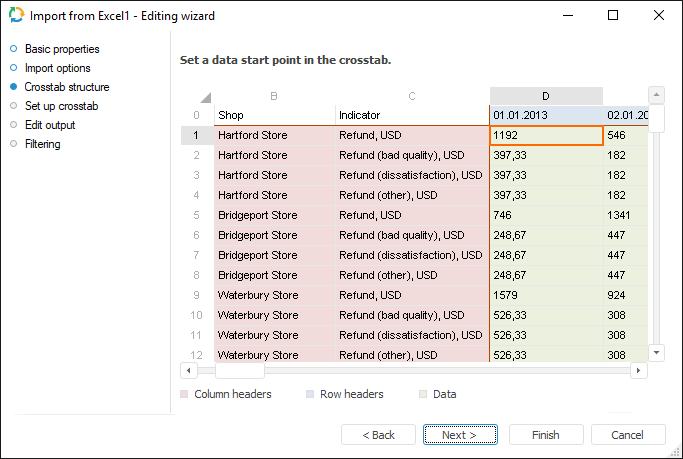
The editing wizard automatically determines numeric data start area. If required, change the data start area by selecting the required cell using the main mouse button or control keys.
The color of selected cells represents data type. The legend presents dependency of data type from cell color. Cells in white are those, which will be excluded on crosstab setup and will not be imported. Cells, which were excluded, will be used as column headers.
Setting Up Crosstab
To set up crosstab:
Set up crosstab structure.
Go to the Set Up Crosstab page:
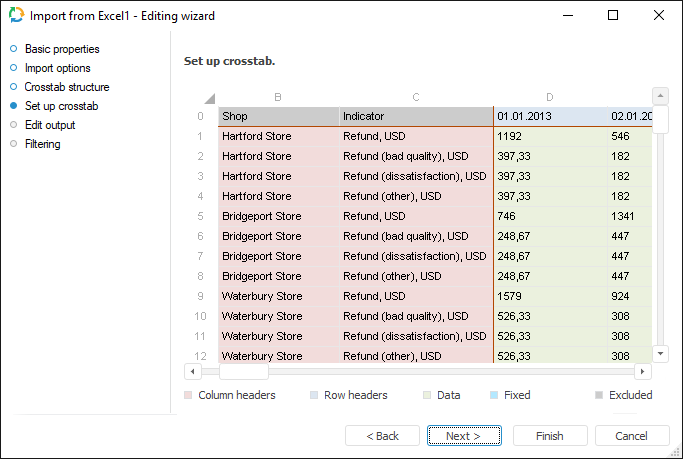
This page enables the user to change the range of imported data:
Exclude rows or columns. Select the Exclude item in the context menu for boundary columns and/or rows. Data in these columns is not imported. It is impossible to exclude a single row or column. To add excluded rows or columns to the range of imported data, select the Include item in the context menu of columns and/or rows.
Fix cells, which were excluded. Select the Add Fixed Cell item in the cell's context menu. Excluded cells are the cells located outside crosstab, that is, the cells that are excluded from row and column headers and that are not of data type. To delete a fixed cell, select the Delete Fixed Cell item in the cell's context menu.
Edit Output
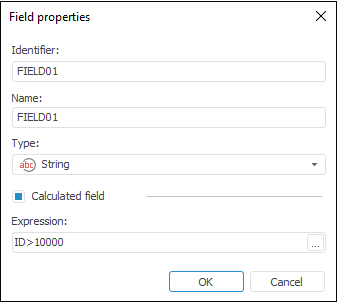
The Edit Output page enables the user to set links to the consumer object, to which data on executing ETL tasks is loaded.
NOTE. The page is common to all data connectors and transformers, except for the Split and User Algorithm transformers. Consider setting up a list of fields and output links using the example of the Repository data source editing wizard.
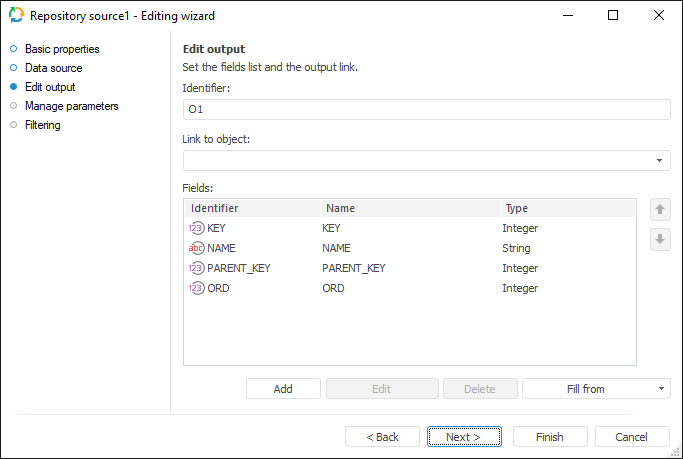
The following settings are available on the page:
Filtering
On the Filtering page specify the condition, according to which the imported data will be selected.
NOTE. The page is common to all data provider connectors, except for the User Provider connector. Consider setting up data provider filtering using the example of the Repository data provider editing wizard.
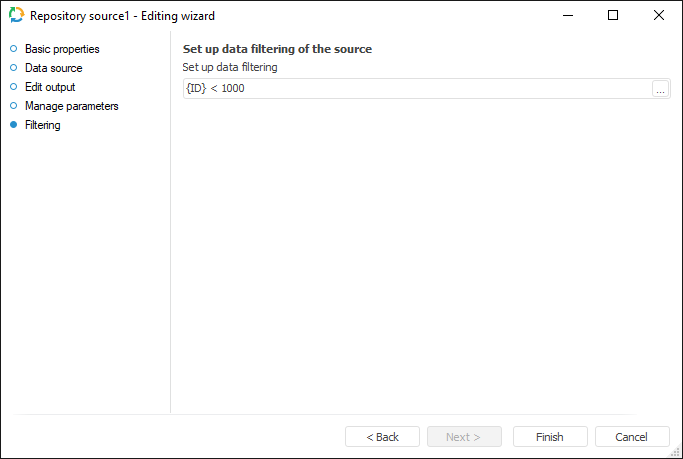
To create a filtering condition, click the ![]() Browse button. The expression editor dialog box opens. All provider fields can be used to create an expression. The data that satisfies the specified condition is imported.
Browse button. The expression editor dialog box opens. All provider fields can be used to create an expression. The data that satisfies the specified condition is imported.