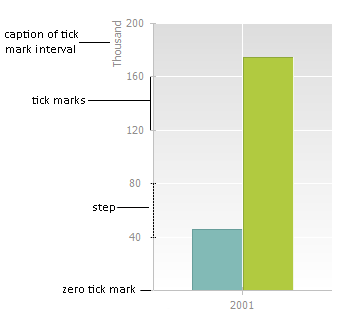
A scale is a set of tick marks that correspond to some values of a physical quantity:

Tick mark is a mark on the scale that corresponds to certain value of a physical quantity.
Major tick marks are the marks shown in the scale by default.
Minor tick marks are additional shortened scale tick marks located between major tick marks.
Tick mark intervals is the difference between values that correspond to two neighbor scale tick marks.
A zero tick mark is the scale tick mark that corresponds to zero value of the measured value.
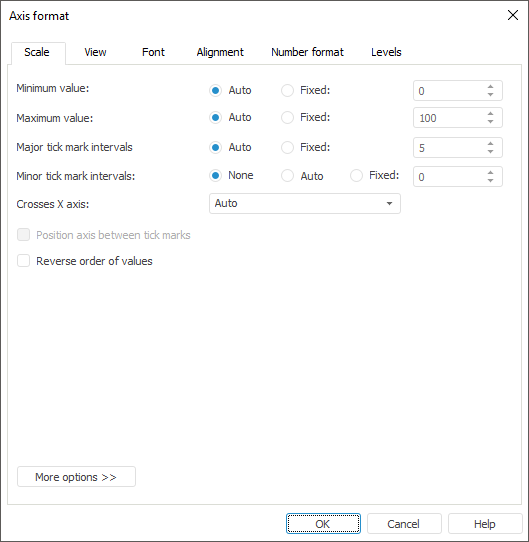
To set up axis scale, go to the Scale tab of the Axis Format dialog box. The setup is available only in the desktop application for all chart types except for pie and doughnut charts, secondary histogram and secondary pie chart.
TIP. To quickly set up chart axes parameters, use the Category Axis (X), Value Axis (Y) and Value Axis (Secondary) tabs on the side panel.
The Scale tab look depends on the selected axis:

The user can determine the following settings on the tab:
NOTE. Settings of the secondary axis are identical to settings of the Y axis scale.
The Scale tab of the X axis for a scatter and bubble charts looks identical to the tab for Y axis. The only exception is the Crosses Y Axis setting because both axes of these chart types are the value axes.
To change chart scale orientation:
Select the required scale orientation in the Chart Type dialog box.
Select or deselect the Invert checkbox on the Chart tab of the side panel.
See also:
Chart Axes | Setting Up General Chart Parameters | Setting Up Chart Components