Setting Up Y Axis Scale
To set up Y axis scale, go to the Scale tab of the Axis Format dialog box. The tab in the looks the same as the tab for the secondary axis and the tab for the X axis of scatter and bubble charts.
Advanced setup of Y axis scale is available only in the desktop application.
TIP. To quickly set up chart axis parameters, use the Value Axis (Y) side panel tab.
The Scale tab contains basic and advanced settings of Y axis.
To toggle between the basic and advanced settings of Y axis, use the More Options and the Less Options buttons.
Basic Settings
Determine the following scale settings:

 Set minimum value
Set maximum value
Set up major tick mark intervals
Set up minor tick mark intervals
Set up intersection with X axis
Set up axis position
Set up order of values
Advanced Settings
To additionally set up major tick marks, use the operations in the Major Tick Marks group of parameters:
Set up the number of intervals
Set up distance between tick marks
Set up scale plotting mode
To additionally set up minor tick marks, use the operations in the Minor Tick Marks group of parameters:
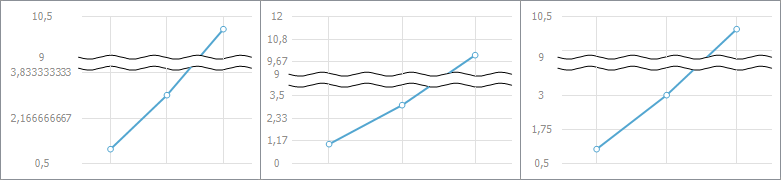
Set up scale breaks
Set up displayed units (scale)
Features of Setting Parameter Values
On setting up of some parameters it is possible to set values with accuracy up to 15 digits. These parameters are the following:
See also:
Chart Axes | Setting Up Report Scale | Setting Up X Axis Scale | Setting Up General Chart Parameters | Setting Up Chart Components