 To open the monitoring window
The Business Process Management extension window in the process monitoring mode displays all running process instances available for the user. A process instance is a process running with specific parameter values. The number of running instances is unlimited. Appropriate color indication is used to display execution statuses of process instance stages/steps.
 To open the monitoring window in the Designer of Business Applications extension in the web application
Process monitoring mode and a set of running process instances in it can differ depending on process role model settings:
Full monitoring. It enables the user to fully control process execution. It is available for process owner and administrator, as well as process step execution owner when working with the repository based on Oracle DBMS.
Custom monitoring. It displays the user information about the steps assigned for execution and if they are available for work. It is available for step execution owner during the work with the repository based on Microsoft SQL Server DBMS, PostgreSQL/Postrgres Pro DBMS.
Full monitoring window with the list of running process instances:

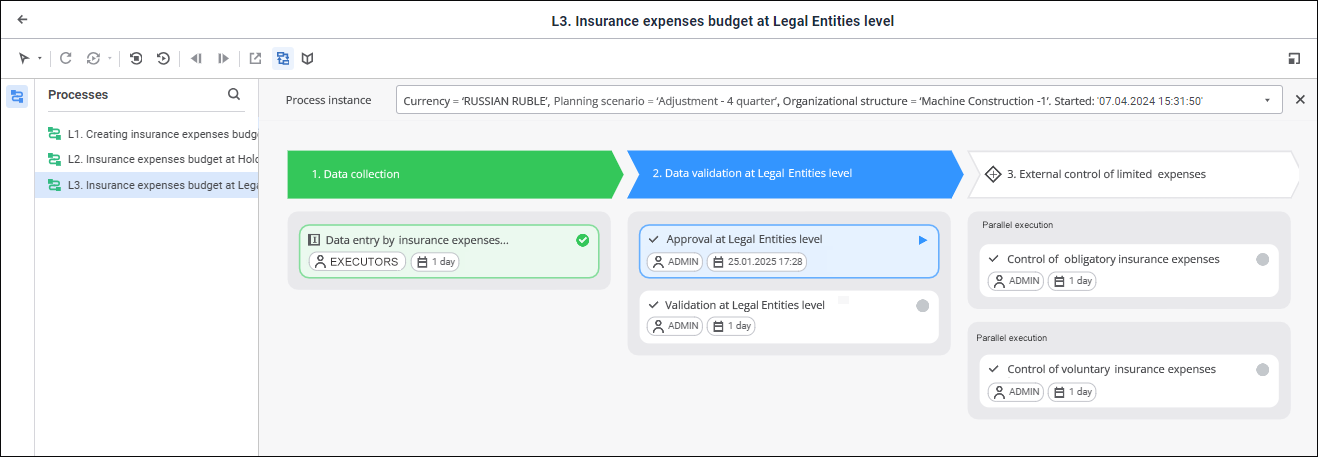
Full monitoring window with the business process scheme:

In the full monitoring window with the business process schema one can view basic properties of all process steps.
To view the process scheme, double-click the selected process instance in the list of running process/subprocess instances. To go back to the list of running instances, click the  Go Back to the List of Instances button on the toolbar.
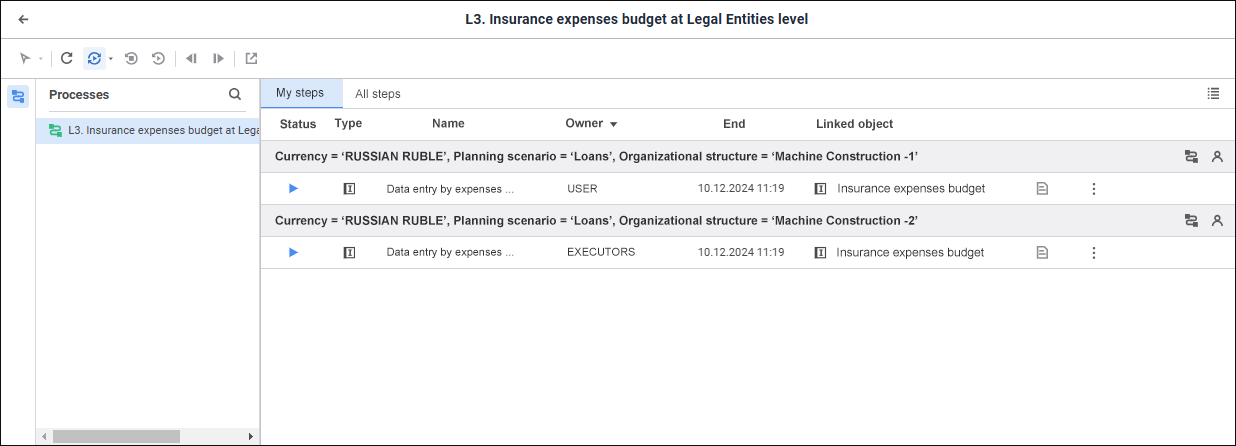
Custom monitoring window with the list of process steps assigned to the user for execution:

The working area with the list of assigned steps includes the tabs:
NOTE. Steps assigned for execution are distributed by their belonging to process instances.
Each tab contains:
Process instance information.
Set parameter values.
View step in the process scheme. To do this, click the  Open Instance Chart button.
Information about process owner displayed on hovering on the  icon.
icon.
Information about assigned steps for execution in columns:
Status. It displays the step status icon.
Type. It displays the icon corresponding to step type.
Name. It contains name of the assigned step.
Owner. It displays the executor assigned for the step.
End. It displays step execution end date and time.
Description. It displays information that characterizes step and is specified during step setup. It is marked with the  icon. Hovering on the
  icon displays a tooltip with description text.
Comment. It displays information specified by the user in the Comment box during the work with the step. It is marked with the  icon. Hovering on the
  icon displays a tooltip with comment text.
Linked Object. It contains the link to the object attached in the step. The linked object depends on the selected step type.
NOTE. To display the linked object of selected step, click the name of the linked object in the Linked Object column.
The Status, Owner, and End columns can be sorted by clicking the column header. Sorting is executed only by one column.
On consequent pressing on any of icons in the column header its view is changed, therefore the sorting type is changed:
 . Descending sorting (in case if there are text values from Z to A).
 . Ascending sorting (in case if there are text values from A to Z).
NOTE. Descending sorting application order for the Status column corresponds to description of step execution statuses. Ascending sorting is applied in reverse order.
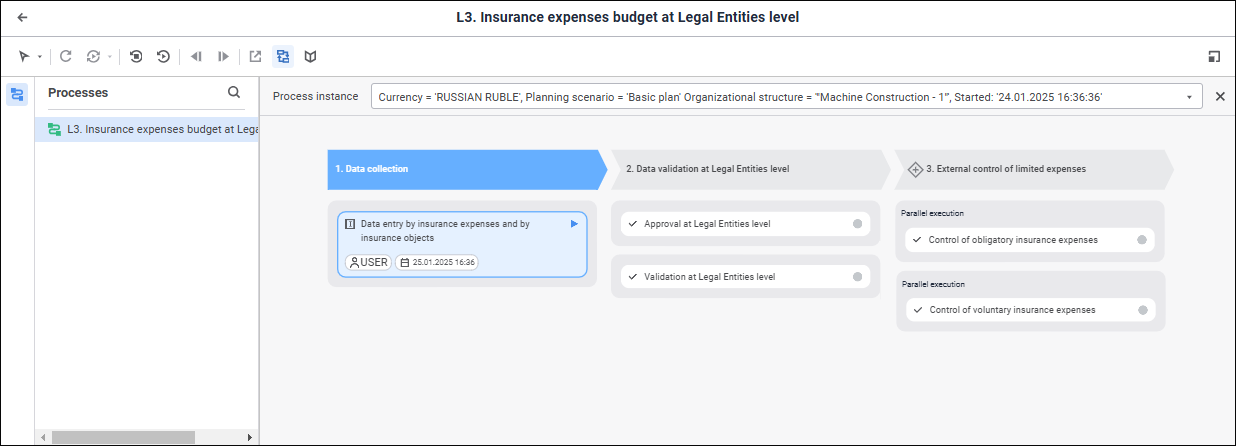
Custom monitoring window with the business process scheme:

In the custom monitoring window with the business process scheme the step execution owner can view basic information only for the step, for which execution he is responsible.
To view the process scheme containing assigned process steps, click the  Open Instance Chart button next to the selected process instance. To go back to the list of assigned steps, click the
  Go Back to the List of Instances button on the toolbar.
To execute process instance:
Refresh process monitoring if required.
Select the step executor from the group of responsible users if required. It is available only for process owner and administrator.
Execute process steps depending on the step execution method:
Automatic. The step is started and executed automatically. The steps of the process with automatic execution method are marked with the  icon.
icon.
Manual. The step is executed manually. When executing the step, dependent objects are available for editing and viewing that are set on creating the step on the Settings side panel.
When executing process steps one can reject the active process step.
Browse the process stages or steps execution log if required.
The table contains available functionalities depending on monitoring mode:
| Functionality | Full monitoring (process owner, administrator) | Custom monitoring (step execution owner) |
| Refresh process monitoring |
|
|
| Select responsible for process step |
|
|
| Execute process steps in manual mode |
|
|
| Reject process step |
|
|
| Restart/Stop process instance |
|
|
| Process instance search |
|
|
| Filter list of process instances by parameters |
|
|
| Set up working area |
|
|
| View log |
|
|
To clear processes monitoring and initialize task container, use the Clear Monitoring unit. Clearing is available for the ADMIN administrator who is the schema owner.
In the process monitoring working area:
A step is given a status.
Each stage or step is indicated with color.
Each step displays basic properties.
NOTE. Viewing basic properties of all process steps is available for the process owner and administrator when the process scheme is displayed in the monitoring. The step execution owner can view basic information only for the step, for which execution he is responsible.
Each step status is marked with an icon:
 - step is not started.
 - step is active and available for execution.
 - step is finished and executed correctly.
 - step is rejected.
 - step is active and expired.
 - step is executed and expired.
 - step is executed but with failure. For example:
If an algorithm that has an error in calculation formula is selected in the Calculation step, this step is executed but the monitoring window indicates the step status as Finished with Error.
If subprocess instances have been force stopped, the monitoring window indicates status of the Subprocess Call step as Finished with Error.
The following colors are used for stage/step indication:
Solid blue. The stage or step is being executed.
Solid green. The stage or step is executed on time.
Solid red. The stage or step is expired.
Solid yellow. The stage or step:
Rejected and is not expired.
Executed and expired.
Solid white. The step is not started.
Solid grey. Stage is not started or step is disabled.
To view description of step status icons in the custom monitoring, open the legend by clicking the  Legend button.
Steps of the process with automatic execution method are marked with the  icon.
icon.
See also:
Getting Started with the Business Process Management Extension | Executing Process Steps in Automatic Mode | Executing Process Steps in Manual Mode