Tool interfaces in the web application and in the desktop application are identical, and differences in functionality are given in appropiate commments.
Analytical queries (OLAP) enable the user to quickly create reports allowing to analyze arbitrary data dimensions by means of visualizers.
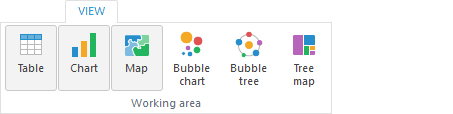
The following visualizers are available:
Table. It is a spreadsheet based on the data source from platform repository. A data cube generally can contain any number of dimensions. To view the cube as a table some dimensions are fixed, each of them determines an element for creating a data slice. Data slice is a two-dimensional data table, which heading and sidehead show elements of cube dimensions arranged by columns and rows.
Chart. It is based on any table area and maintains connection with data. Any changes in table data lead to chart rerendering taking into account the changes.
Map. It is based on a two-dimension table and usually consists of one row or column from this table as territory fill. Territory fill is determined by start and end colors, which correspond to minimum and maximum values on the map. Colors of intermediate values are calculated automatically.
Bubble chart. Scatter chart where data points are replaced with bubbles and its color and sizes serve as additional data dimensions. A bubble chart does not have the category axis. The horizontal and vertical axes are value axes. In addition, a bubble chart contains an animated timeline, which displays the frequency of values.
Bubble tree. It is a way of displaying hierarchical data as a set of interrelated bubbles. Each hierarchical branch is represented with a bubble related with bubbles that are elements of the same hierarchical level. All elements of the same branch and the same hierarchical level form a circle, the center of which shows the parent element of the hierarchy. Diameter of each bubble is proportional to value of the corresponding hierarchical element. Bubble color also depends on value of the hierarchical element.
Tree map. It is a way of displaying hierarchical data as a set of nested rectangles. Each hierarchical branch is represented with a rectangle that consists of smaller rectangles that are subbranches. Area of each rectangle is proportional to value of the corresponding hierarchical element. Rectangle color also depends on value of the hierarchical element.
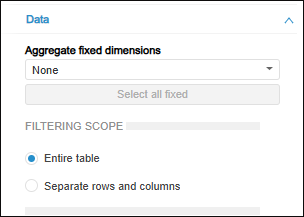
Aggregation enables the user to execute multiple selection of fixed dimensions elements by means of the selected aggregation method.
NOTE. Aggregation of fixed dimensions is not available if global cache is used.
To aggregate fixed dimensions:
Select data visualizer.
NOTE. Aggregation is used for all visualizers built on one source.
Go to the Data tab from the Source side panel group.
Select the required aggregation method from the Aggregate Fixed Dimensions drop-down list:
None. Data is not aggregated.
Sum. The summation is executed by selected elements in fixed dimensions.
Maximum. The maximum value is displayed from selected elements in fixed dimensions.
Minimum. The minimum value is displayed from selected elements in fixed dimensions.
From Source Dimensions. Fixed dimension data is handled with the aggregation method specified in settings of data source.
When working with ADOMD cubes, the aggregation set up in the corresponding ADOMD sources is used.
From Source Facts. In fixed dimensions with full selection server aggregation is used according to the methods specified for source facts is set up for data source. Source facts aggregation should be set up if a data source contains several records for one set which should be aggregated.
If the Aggregate Selected Elements Onlycheckbox is selected in cube dimension aggregation settings, and on the Facts Binding page the aggregation method is selected for facts, aggregation is calculated on server by selected elements according to the methods specified for cube facts. When single selection is used for parent element, aggregation is executed only for its child elements. If only parent element is selected without child elements, data is not aggregated into it. If the checkbox is deselected, aggregation in multiple selection is executed by the whole dimension regardless of the selection. When single selection is used for parent element, aggregation is executed for its child elements.
Average. The average value is displayed by selected elements in fixed dimensions.
NOTE. When selecting any item in the list, except for None, the Select All Fixed button becomes active, when clicking on it, all items in fixed dimensions will be selected.
It is available in the web application.
If in a table:
Selected elements contain identifiers of different measurement units.
Structure of the dimension that includes these elements corresponds to structure of indicators dictionary.
A cube does not contain units dictionary and the Do not Aggregate Different Measurement Units checkbox is selected.
during aggregation of fixed dimensions:
The Selection group of tabs next to the dimensions that includes these elements will display the  icon and a tooltip.
The calculated cell will display the "-" character instead of the value. To change character or text, use the IPivot.UnmatchedUnitsText property. To display character or text during aggregation of fixed dimensions, the dimension should be fixed.
When displaying of icons for calculated cells is enabled, the calculated cell will display both characters. The =- characters are displayed by default.
Select the data layout mode in the drop-down list:
By clicking the  Layout button at the top right corner of the working area. Button appearance depends on the set mode.
By clicking the ![]() Layout button on the View ribbon tab.
Layout button on the View ribbon tab.
Available modes of data visualizers layout:
A visualizer is selected using the group of buttons in the top right part of the working area.
Depending on the selected data layout option, this button group for selecting a visualizer can look differently:
On Tabs. Radio buttons control the view modes. Only one visualizer can be selected:

Horizontally/Vertically. Buttons control the view modes. Multiple selection of visualizers is available:

To show or hide visualizer, press or release the button corresponding to the visualizers in the Working Area group on the View ribbon tab:
NOTE. It is impossible to hide all visualizers, at least one visualizer is displayed.
See also:
Data Visualizers| Selecting Data for Building Visualization

 On tabs

