A map is used in various tools of Foresight Analytics Platform: Reports, Information Panels, Analytical Queries (OLAP), and Time Series Analysis.
Key features:
Connect external map services.
Data drilldown and drillup.
Use geolocation markers, arrows, pie and bar charts.
Set up tooltips, legend.
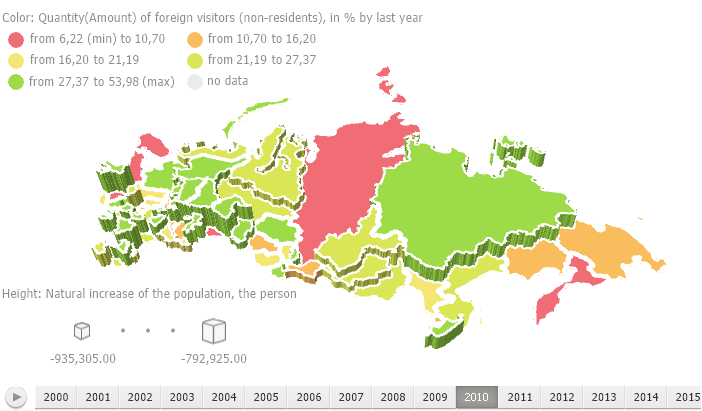
3D map mode.
Set up map style and display territory borders.
For details see the sections: Getting Started, Setting Up Dimensions for Working with Map, Setting Up Map, Map Advanced Features.
IMPORTANT. Before getting started with the visualizer make sure that system requirements to client computer are met for the desktop application, and to BI server for the web application. The web application supports work with visualizers if BI server is installed on Windows 11 or later. The visualizer may look differently depending on the DirectX 11 or OpenGL 3.1 graphics libraries in use.
See also: