A bubble tree displays hierarchical data as a set of interrelated bubbles. Each hierarchical branch is represented with a bubble related with bubbles that are elements of the same hierarchical level. All elements of the same branch and the same hierarchical level form a circle, the center of which shows the parent element of the hierarchy. Each bubble's diameter is proportional to the value of the corresponding hierarchical element. Bubble color also depends on value of the hierarchical element.
IMPORTANT. Before getting started with the visualizer make sure that system requirements to client computer are met for the desktop application, and to BI server for the web application. The web application supports visualizers if BI server is installed in Windows 10 or later. The visualizer may look differently depending on the DirectX 11 or OpenGL 3.1 graphics libraries in use.
A bubble tree enables the user to display two-value sets for hierarchical data:
The first value determines bubble color.
The second value determines bubble diameter.
Bubble tree advantages:
It enables the user to find interrelation between two factors in a hierarchical data structure.
It enables the user to show relations between hierarchical elements in a visual form.
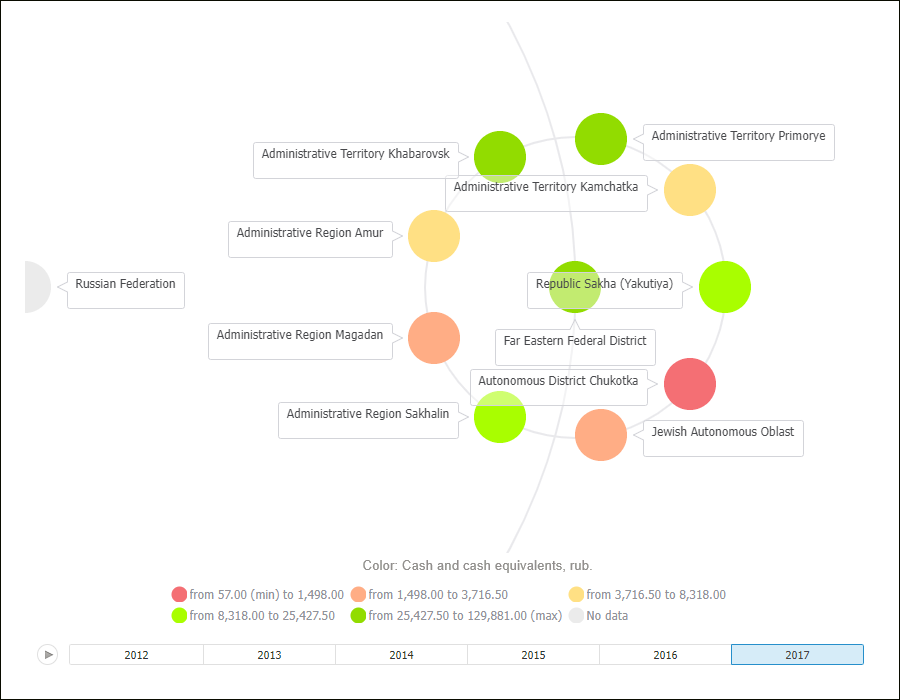
Example of the Bubble Tree data view:
Get started with a bubble tree by setting up dimensions.
See also:

 Set up metrics dimension