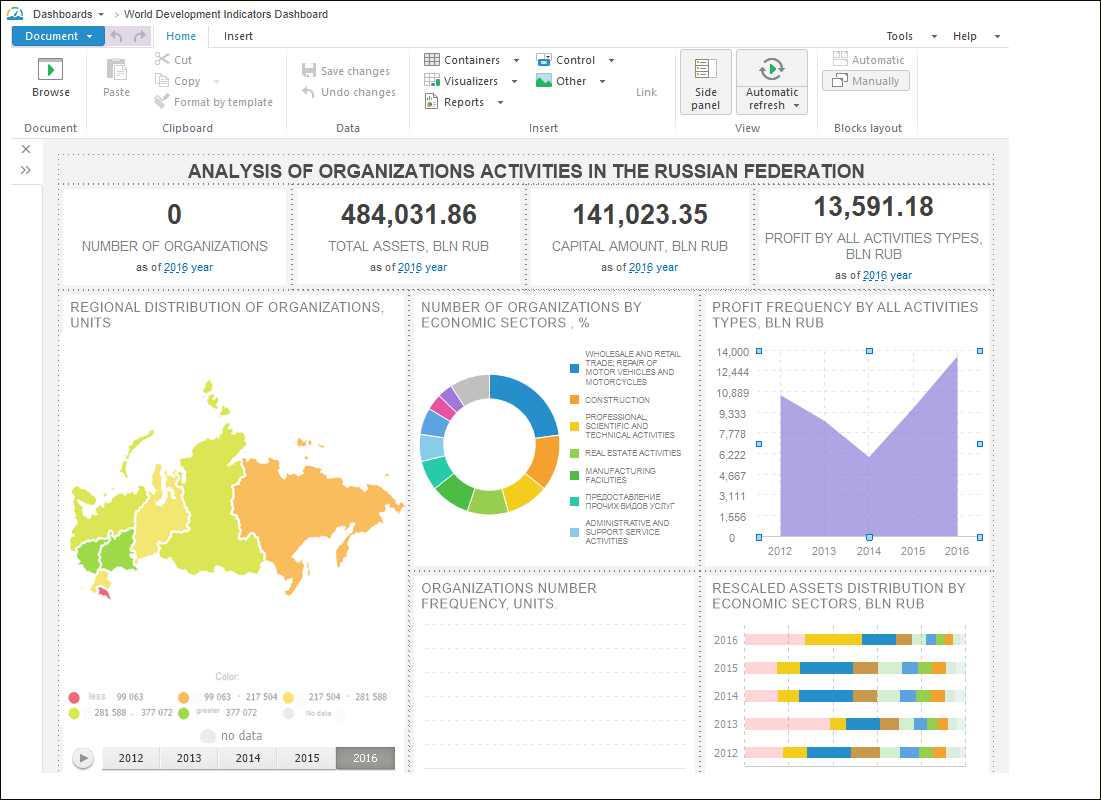
Tool interfaces in the web application and in the desktop application are identical, and differences in functionality are given in appropriate comments.
Dashboards can be built by means of the Dashboards tool:

Key features:
Interchangeable visualizers: tables, charts, maps, factors.
Working according to the WYSIWYG principle (What You See Is What You Get), that is, the user sees at once how a dashboard looks like.
Using objects from other tools without additional settings.
Analyzing several data sources in one visualizer.
Rich analytical capabilities and adding analysis results to a dashboard thanks to a built-in advanced analytics block.
To work with the Dashboards tool, you will need:
The PP_DashboardEditor feature to build and edit a dashboard.
The PP_DashboardViewer feature to explore interactively ready dashboard.
Data sources. Cubes, child cubes of modeling container and time series database are available as a data source. If a required data source is absent in the repository, it can be added by using data import wizard.
To get started with the tool, see the Getting Started with the Dashboards Tool article.
To build dashboards, see the Building Dashboard article.
To work with ready dashboards, see the Working with Ready Dashboard article.
If you still have questions, see the Questions and Answers article.
See also:
Getting Started with the Dashboards Tool | Building Dashboard | Working with Ready Dashboard | Questions and Answers