A tree map allows hierarchical data to be displayed as a set of nested rectangles. Each hierarchical branch is represented with a rectangle that consists of smaller rectangles, which are subbranches. Area of each rectangle is proportional to value of the corresponding hierarchical element. Rectangle color also depends on value of the hierarchical element.
IMPORTANT. Before getting started with the visualizer make sure that system requirements to client computer are met for the desktop application, and to BI server for the web application. The web application supports visualizers if BI server is installed in Windows 10 or later. The visualizer may look differently depending on the DirectX 11 or OpenGL 3.1 graphics libraries in use.
A tree map enables the user to display two value sets for hierarchical data:
The first value determines rectangle color.
The second value determines rectangle area.
Tree map advantages:
It enables the user to find interrelation between two factors in a hierarchical data structure.
It enables the user to use space efficiently.
It enables the user to clearly display a large number of elements at the same time.
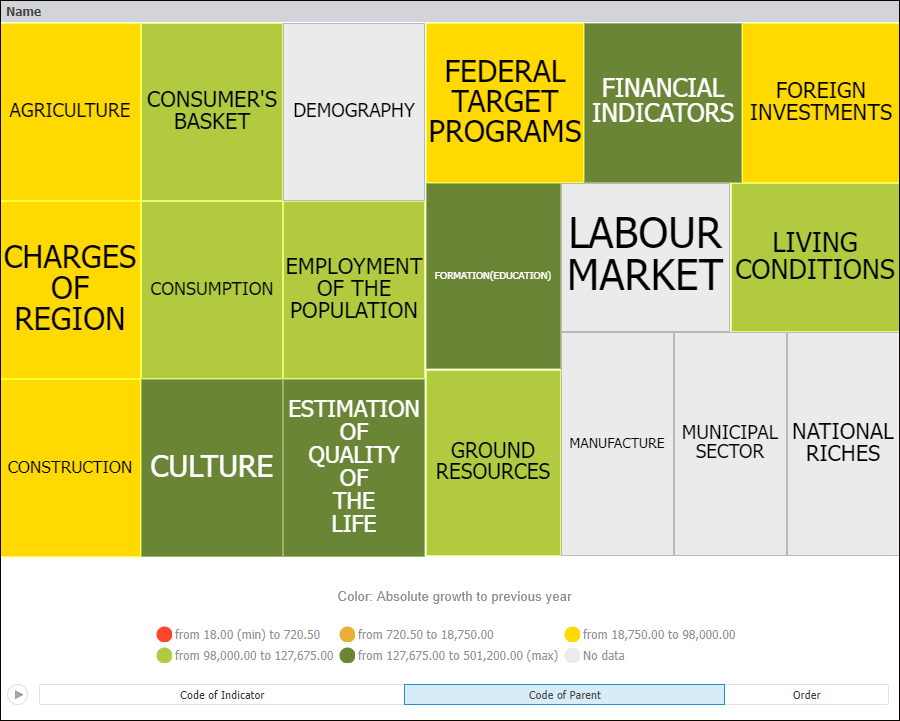
Example of the Tree Map data view:
Get started with a tree map by setting up dimensions.
See also:

 Set up metrics dimension