Table
The Table visualizer is used to structure data as a spreadsheet.
Key features:
Data analytics in table: transformation, ranking, conditional formatting, summary statistics, etc.
Data drill down and drill up to move by levels: from multidimensional data to relational level and vice versa.
Data validation.
Totals calculation and formulas calculation setup.
Display data access permissions as icons.
Table and its elements appearance setup.
The Chart visualizer is used to graphically display table data using various chart types.
Key features:
Select chart type, set up 3D view and gaps between chart data series.
Drill down and normalization of displayed data.
Display calculated values.
Set up tooltips, data labels, legend, headings, chart axis.
Use chart corridors, level line and trend.
Set up chart data series.
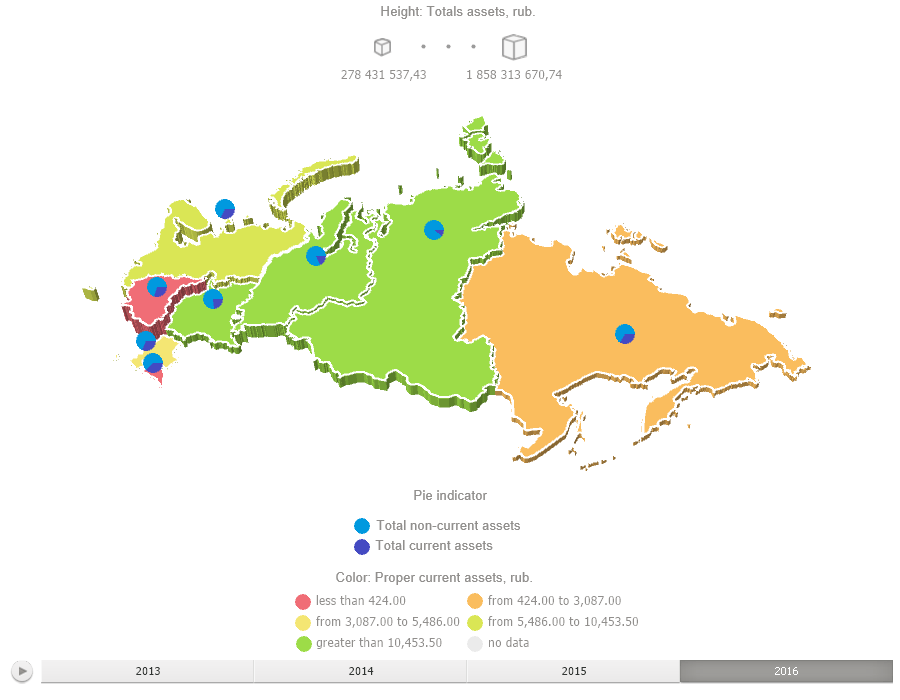
The Map visualizer is used to graphically display table map data with value frequency by time.
Key features:
Connect external map services.
Data drill down and drill up.
Use geolocation markers, arrows, pie and column charts.
Set up tooltips, legend.
3D map mode.
Set up map style and territory contour display.
Bubble Chart
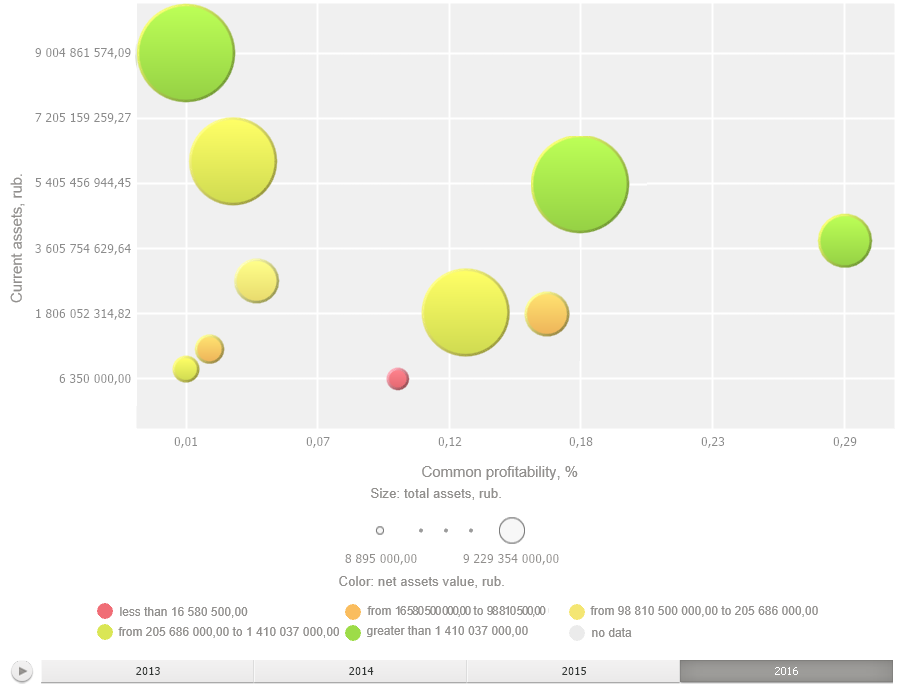
The Bubble Chart visualizer is used to display table data as bubbles built as a scatter chart with value frequency in time.
Key features:
Data drill down and drill up.
Display bubble traces to analyze data changes in time.
Set up tooltips, legend, chart axis.
Use trend line.
Set up bubble chart style, color scale and size scale.
Bubble Tree

The Bubble Tree visualizer is used to graphically display table data as a set of interconnected bubbles with value frequency in time.
Key features:
Data drill down and drill up.
Set up tooltips and legend.
Set up color scale and size scale.
Tree Map
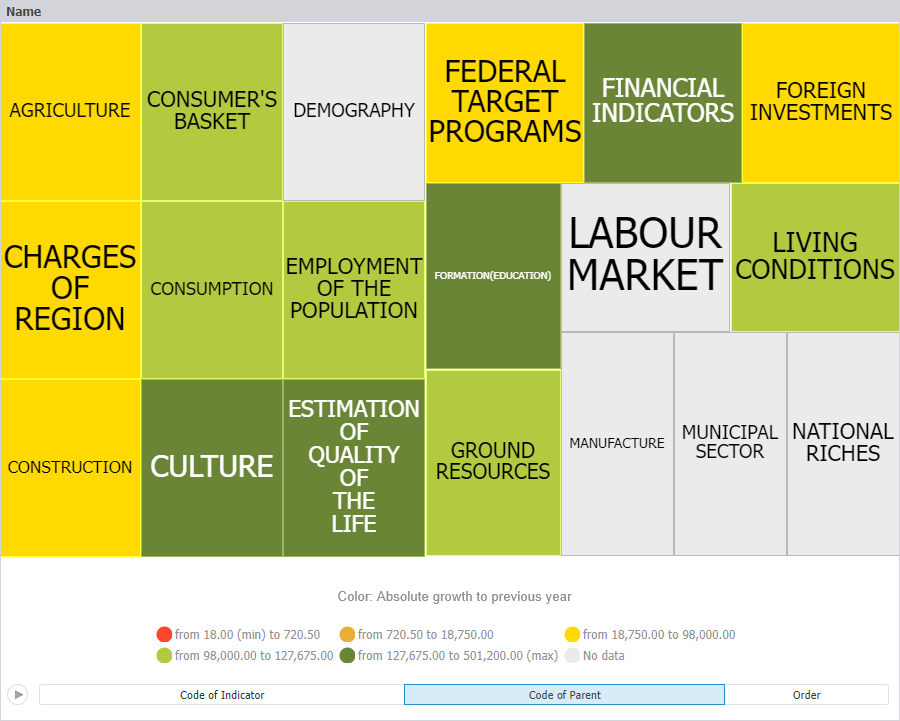
The Tree Map visualizer is used to graphically display table data as a set of nested rectangles with value frequency in time.
Key features:
Data drill down and drill up.
Set up tooltips and legend.
Set up color scale and size scale.