A chart is a form of graphic presentation of table data and is used to visually display tables:
To create a chart, enable corresponding visualizer. To do this, click the Chart button on the View ribbon tab.
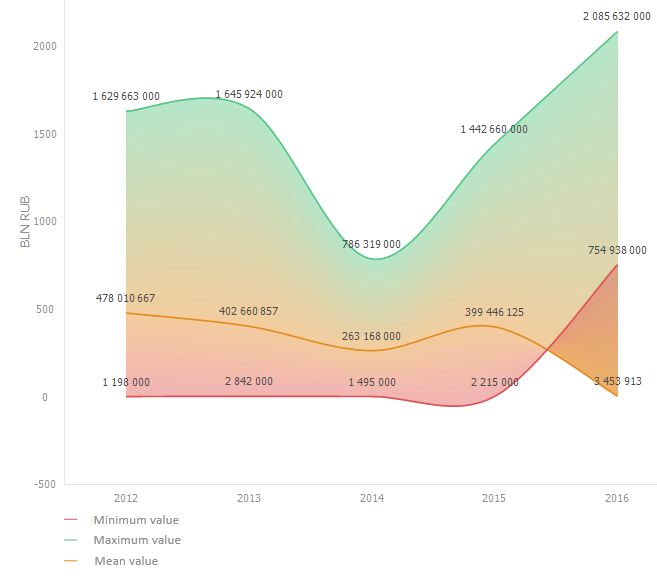
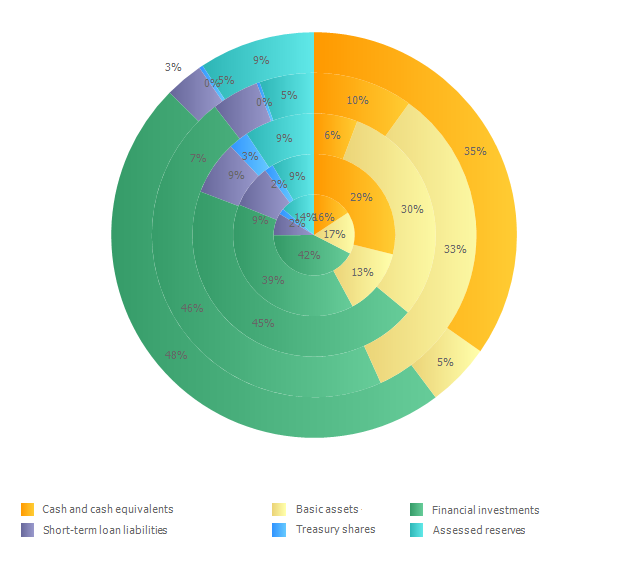
To get familiar with chart examples and their building settings, see the Chart Examples sections.
The following operations are available on working with a chart:
For full description of chart capabilities see the Setting Up Chart Components section.
See also:
Setting Up Chart Components | Chart Types | Chart Examples