Trend lines are used to graphically display trends in data and forecast their future changes. This type of analysis is named regression analysis. By using regression analysis, the user can extend a trend line in a chart beyond the actual data to forecast future values.
Working with trend lines is available for all chart types, except for radar, pie, doughnut, stock exchange, box, stepped, waterfall, secondary histograms and secondary pie charts. When chart type changes to one of the above listed, the trend lines corresponding to chart data, are lost.
See below an example of a trend line created with the forecast for three points forward:
The following approaches are used on setting up data series:
To set up a trend line, use the Trend Line group on the Data Series side panel tab.
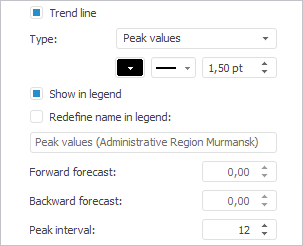
To show a trend line:
Select the Trend Line checkbox on the Data Series side panel tab.
Select Add Trend Line in the series's context menu.
NOTE. This command is available only in the desktop application.
After executing one of these operations a trend line is added to the chart.
After the trend line is displayed, the following operations are available:
 Set up trend line displaying in the chart plot area
Set up trend line values forecast
See also:
Data Series | Setting Up General Chart Parameters | Setting Up Chart Components


