To display the data in the report, put visualizers on the table sheet:
To change data set presented by visualizers, use selection.
To enhance data visualization capabilities and regular report functions, in the web application and in the designer of business applications connect plugins. Plugins can be connected on separate report sheets.
Aggregation enables the user to execute multiple selection of fixed dimensions elements by means of the selected aggregation method.
NOTE. Aggregation of fixed dimensions is not available if global cache is used.
To aggregate fixed dimensions in a slice:
Select the visualizer:
If it is a table, place the cursor in the cell of the table visualizer.
If it is a chart or map, click on it with the left mouse button.
NOTE. Aggregation is applied for all visualizers built on one source.
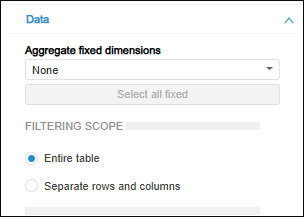
Go to the Data tab from the Data group on the side panel:
Select the required aggregation method in the Aggregate Fixed Dimensions drop-down list:
None. Data is not aggregated.
Sum. The selected elements in fixed dimensions are summed.
Maximum. The maximum value is displayed from the selected elements in fixed dimensions.
Minimum. The minimum value is displayed from the selected elements in fixed dimensions.
From Source Dimensions. Fixed dimensions use aggregation according to the set aggregation methods of source dimensions. The aggregation configured in the corresponding ADOMD sources is used on working with ADOMD cubes.
From Source Facts. Fixed dimensions use aggregation according to the set methods of source facts aggregation.
Mean. The mean of selected elements in fixed dimensions is displayed.
NOTE. On selecting any item in the list, except for None, the Select All Fixed button becomes active. When you click on it, all elements in fixed dimensions will be selected.
The Reports tool enables the user, on selecting a cell range in table visualizer, to rebuild visualizers built on the same slice as the table. Visualizers are charts and maps.
To select a table area, by which visualizers are built:
Select table visualizer in the working area.
Go to the Designer ribbon tab.
Click the  Visualizer Data button and select visualizer building option:
Entire Table. Visualizers are built by the entire table.
Selected Area. Visualizers are built by the data selected in the table.
After setup, visualizers are rebuilt according to the set parameters. Visualizers are rebuilt both in the view mode and in the edit mode of regular report.
If data is selected in two or more tables, visualizers are not rebuilt.
If selected data contains working area cells that are not included into the table, visualizers are not rebuilt.
If one cell or corner is selected in the data area table, visualizers are rebuilt by the entire data table.
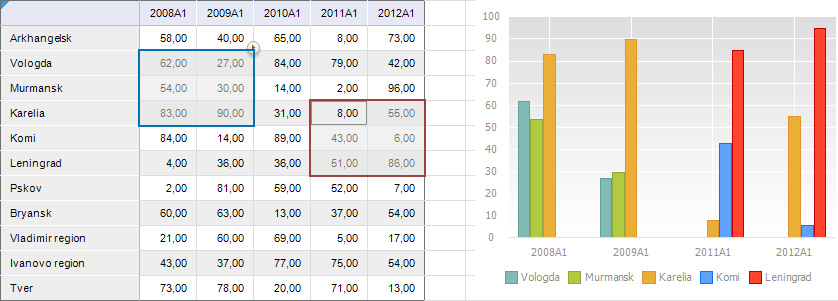
If several cell ranges are selected in the data area table by means of the CTRL key, visualizers get the joined selection by rows and columns by all selected ranges. For example:
See also:
Getting Started with the Reports Tool in the Web Application | Building Report