Tap the  button at the top right corner.
Select the Chart Type item in the Chart dialog box that opens.
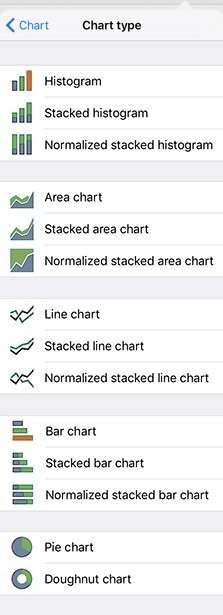
Select chart type:
Express reports use the following chart types:
For all the chart types, except for the pie chart and doughnut chart, one of the following subtypes can be set:
Stacked. This type enables the user to compare the contribution of each value to the total amount by categories.
Percentage. It displays the percentage between values across categories.
To select a chart type:
Tap the  button at the top right corner.
Select the Chart Type item in the Chart dialog box that opens.
Select chart type:

See also: