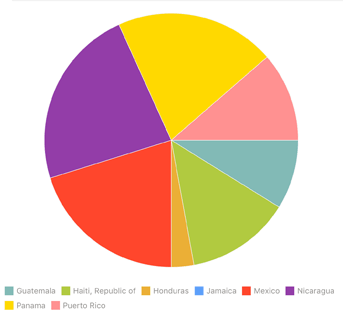

A pie chart is used to visualize relations between the parts and the whole.
Each data category is displayed as a circle that is divided into sectors, which angular sizes are proportional to the values of data elements.
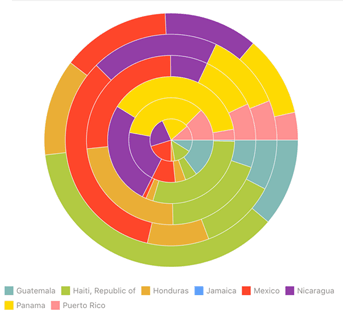
A pie chart can display the values of several categories adding the circles to the ring with data series sectors.
Below are a pie chart for one category (left), a pie chart for several categories (right):


Use doughnut charts to visually display relations between data series in multiple categories.
See also: