A table with the following contents will be used as a relational data source:
To create a relational data area:
Add a table to the regular report as data source.
Place the created source on the report sheet. The Relational Data Area dialog box opens:
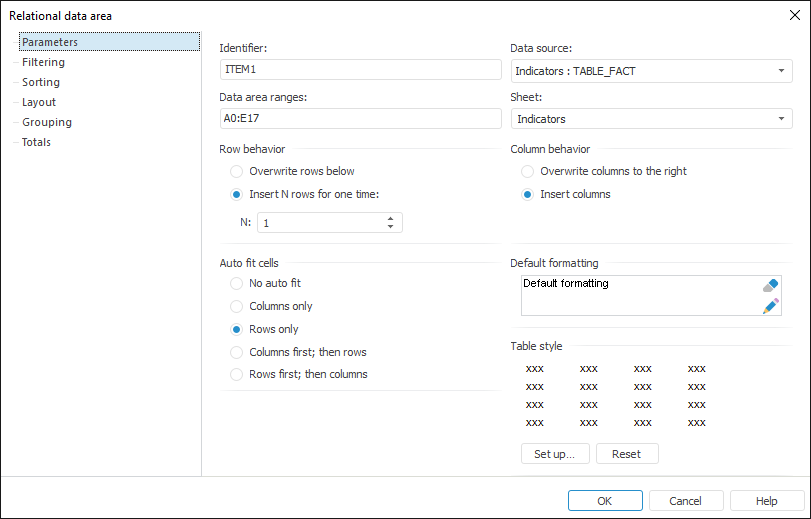
Define the following settings on the Parameters tab:
Data area ranges: A0:E14.
Row behavior: Insert N Rows for One Time (N = 1).
Column behavior: Insert Columns.
Auto fit cells: Rows Only.
Determine the following settings on the Filtering tab:
Select the Show Rows by Condition checkbox.
Enter filtering condition: VALUE > 3.2.
Determine the following settings on the Sorting tab:
Select the checkbox next to the last column identifier.
Select the Descending checkbox in the Selection Properties area.
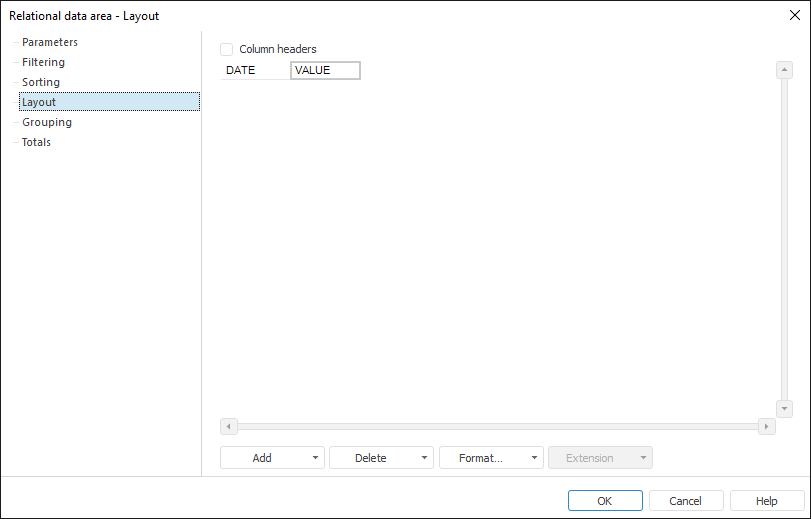
Go to the Layout tab and remove columns that correspond to the following table columns:
Identifier.
Country.
Indicator.
Thus, the tab looks as follows:
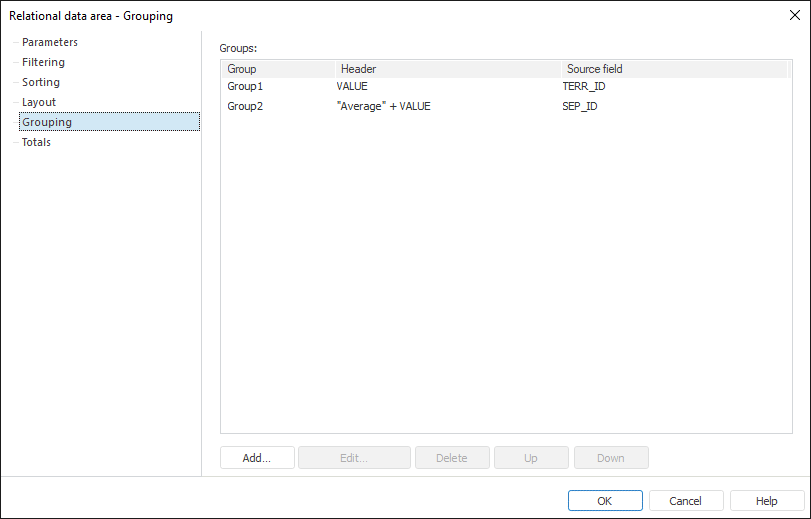
Go to the Grouping tab and click the Add button. The Group Parameters dialog box opens:
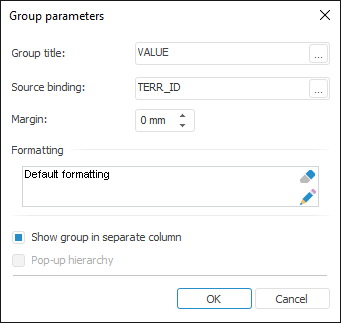
Define the following parameters:
Group Title. Click the  button. The expression editor opens. Set the Value in Cell formula.
Source Binding. Click the button. The Data Source Binding dialog box opens. Select the Data Source Field radio button and select the Country box.
Formatting. Click the  button. The Format Cells dialog box opens. Go to the Font tab. Specify font size and style.
Leave all the other parameters unchanged.
Create another group with the following parameters:
Group title: "Mean " + VALUE.
Binding to the source: the Indicator box.
Thus, the tab looks as follows:
Go to the Totals tab. Select the cell that corresponds to table values (VALUE), and click the Set Up Totals button. The Total Parameters dialog box opens:
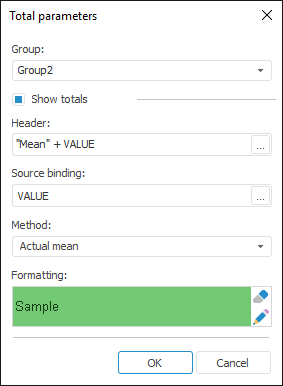
Define the following parameters:
Group. Select Group2.
Show Totals. Select this checkbox.
Header. Click the button. The opens. Set the following formula: "Mean " + Value in cell.
Source Binding. Click the button. The Data Source Binding dialog box opens. Select the Data Source Field radio button and select the Value box.
Method. Select the Actual Mean method.
Formatting. Click the button. The Format Cells dialog box opens. Go to the Fill tab. Set solid background for the totals fill.
The relational data area setup is completed. Click the OK button in the Relational Data Area dialog box.
Calculate the report sheet. Relational data area looks as follows:
See also:
Getting Started with the Reports Tool in the Web Application | Data Visualization as Tables | Relational Data Area | Setting Up Relational Data Area Parameters