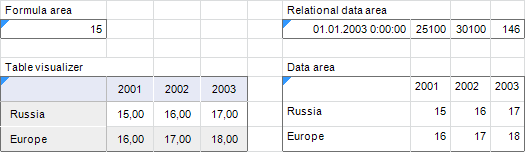
Regular reports contain several types of tables and workspaces to work with data:
Table Visualizer. A data table based on a slice of multidimensional data source. It has advanced functionality. Unlike the data area, table visualizer provides a possibility to use indicators, sparklines, transformations, alternative hierarchy, merging, grouping, dimension detailing with substitutions, aggregation setup on dimensions.
Data Area. Outdated type of data table based on a slice of multidimensional data source.
Relational Data Area. An area that shows data directly from relational objects, such as data tables, queries and views.
Formula Area. A cell range, which values are calculated by a uniform formula.
Each area is marked with a blue triangle at the top left corner:
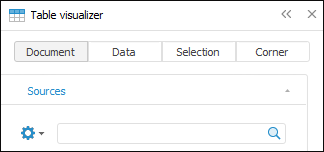
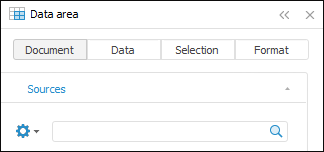
To determine type of data area, select cell of the area and open the side panel. The upper part of the side panel displays name of the selected object type:
 Main differences of table visualizer from data area
See also:
Getting Started with the Reports Tool in the Web Application | Data Visualization as Charts | Data Visualization as Maps | Setting Up Dimensions and Element Selection | Building Report | Working with Ready Report
