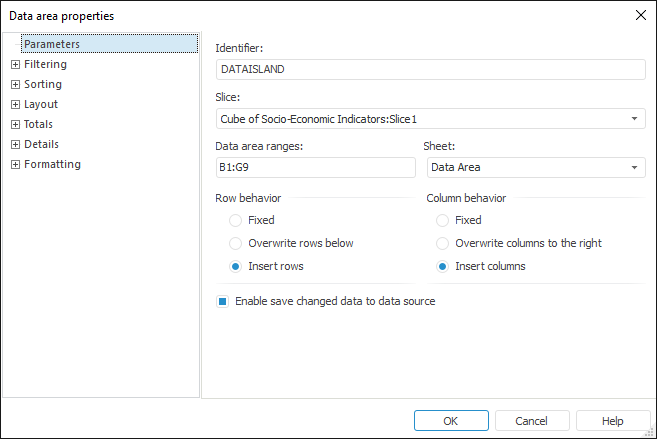
To set data area parameters on creating a new data area, or for an already existing data area:
Select any cell in the area and select the Data Area Parameters context menu item.
Select a data area on the Data Sources and Data Slices panel and select the Data Area Parameters context menu item.
The Data Area Properties dialog box opens after executing any of these operations:

To set up data area properties, determine parameters on the following tabs:
Parameters. Determine general parameters to determine data area position and behavior.
Filtering. Data area filtering enables the user to show only the data that satisfies the specified conditions. For example, on working with large queries that include relatively small number of non-numeric and non-zero data, it can be helpful to use filters for data in rows and in columns.
Sorting. Sorting enables the user to order rows and columns by specific element attributes of the dimensions of the corresponding slice. Data sorting can account for or ignore hierarchy, sorted data can be shown in ascending or descending order.
Layout. Determine parameters of slice positioning in the data area.
Totals. Determine settings of displaying total values of rows and columns for the data area based on source data.
Details. Determine settings for hyperlinks shown in the data area to automatically receive data source details. Therefore, on clicking a hyperlink in the data area, the user can go to another report sheet that displays the data for the selected element in a chart. If details are set up for a dimension or a level, all its elements or some of the elements (if a condition of excluding details elements is specified) in the data area are shown as hyperlinks.
Formatting. Determine formatting settings for data area cells that contain different values, as well as formatting for row and column headers.
NOTE. Name of the Data Area Properties dialog box differs depending on the active tab.
See also:
Getting Started with the Reports Tool in the Web Application | Data Visualization as Tables