Tool interfaces in the web application and in the desktop application are identical, and differences in functionality are given in appropiate commments.
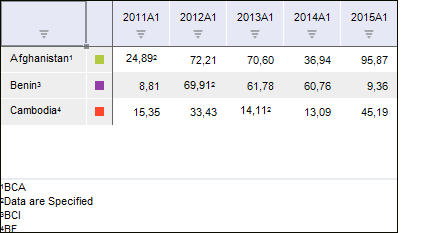
A data table is used to display and work with time series data. Each series has its name, color in a chart and data:
 Change a period of displaying data
Set up format of displayed values
See also:
Working with Time Series | Working with Calculated Series | Data Validation