Tooltips show information on a data series point, level line, data series in the legend when the user hovers the cursor over the corresponding chart element.
NOTE. Tooltips for data series in the legend are displayed in all charts, except for doughnut charts and waterfall charts.
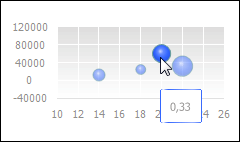
The example of a tooltip:

The following approaches are used to set up tooltips:
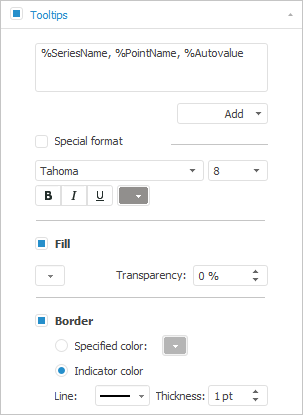
To display tooltips, select the Tooltips checkbox on the Tooltips side panel tab.

After the tooltips displaying is enabled in the chart plot area, the following operations become available:
See also:
Setting Up Tooltips | Templates | Setting Up General Chart Parameters | Setting Up Chart Components