To display the chart in 3D view, select the 3D View checkbox on the Chart side panel tab.
NOTE. Setting up 3D view is only available for histogram, 3D histogram with groups, linear chart, area chart, mixed chart and pie chart.
The 3D effect looks as follows:
The following approaches can be used to set up 3D view:
Quick setup. Use the 3D View and Gaps tab on the side panel.
Advanced setup. Use the 3D View tab in the Chart Parameters dialog box.
Chart appearance with various 3D view settings is given in the Examples of Various Settings of Chart 3D View section.
To set up chart 3D view, use the 3D View and Gaps side panel tab.
NOTE. The 3D View and Gaps tab is available only for 3D histograms, 3D histograms with groups, 3D linear and mixed charts.
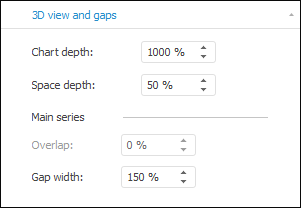
Set the following parameters:
Chart depth. Determine chart depth size. The range of available values: [20, 2000].
Space depth. Determines the distance from the chart front and background border to series. The range of available values: [0, 500].
Advanced setup enables the user to determine 3D view parameters for more chart types.
For advanced setup of 3D chart parameters, go to the 3D View tab of the Chart Parameters dialog box. The tab is displayed if 3D chart view is enabled.
NOTE. Setting up chart 3D view in the Chart Parameters dialog box is available only in the desktop application for the following chart types: histogram, 3D histogram with groups, line chart, area chart, mixed chart and pie chart.
Set the following parameters:
Chart depth. Determine chart depth size. The range of available values: [20, 2000].
Space depth. Determines the distance from the chart front and background border to series. The range of available values: [0, 500].
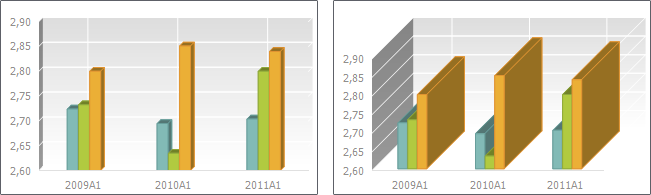
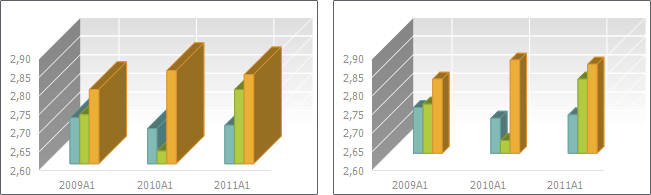
The example of the histogram with chart depth 100 (left) and 1000 (right):
The example of the histogram with gap width 10 (left) and 500 (right):
See also:
Setting Up 3D View and Gaps | Chart Types | Setting Up General Chart Parameters

 To display the tab