The Chart is used to work with a chart based on the Canvas item.
The Chart component is implemented with the Chart class.
The component is used to represent data in the chart. This data is shown as series that have a set of points. For different chart types the user should define specific settings for series and points combined in specific classes. Thus, in an area chart the data series are implemented with the ChartAreaSerie class and the points are implemented with the ChartAreaPoint class. Histograms use ChartColumnSerie and ChartColumnPoint classes respectively, while pie charts use ChartPieSerie and ChartPiePoint classes. Data series of a spline chart is represented with the ChartSplineSerie class.
Both rectangular or polar coordinate systems can be applied when plotting the chart. The polar coordinate system is implemented with the ChartPolarXAxis and ChartPolarYAxis classes.
The Chart component may look as follows:
Example of Creating a Histogram
Example of Creating a Stacked Histogram
Example of Creating an Area Chart
Example of Creating a Pie Chart
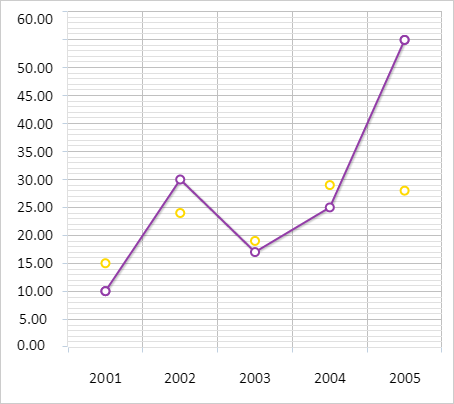
Example of Creating a Line Chart
Example of Creating a Spline Chart
Example of Creating a Scatter Chart
| Constructor name | Brief description | |
| Chart | The Chart constructor creates an instance of the Chart class. |
| Property name | Brief description | |
| AutoRotateMarker | The AutoRotateMarker property determines whether automatic rotation of chart markers is set. | |
| BackgroundColor | The BackgroundColor property determines chart background color. | |
| BorderColor | The BorderColor property determines a chart border color. | |
| BorderEnabled | The BorderEnabled property determines chart border displaying. | |
| BorderStyle | The BorderStyle property determines a chart border line style. | |
| BorderWidth | The BorderWidth property determines chart border width. | |
| Center | The Center property determines chart center. | |
| CircleSize | The CircleSize property determines outer border size of a pie chart. | |
| CircleSizeInPercent | The CircleSizeInPercent property determines a method for setting outer border of a pie chart. | |
| CustomData | The CustomData property determines custom data. | |
| Deep | The Deep property determines X axis length when displaying a 3D chart. | |
| Draggable | The Draggable property determines whether a chart can be dragged. | |
| EditMode | The EditMode property determines an object that is used to edit a chart. | |
| ExcludeInvisibleSeries | The ExcludeInvisibleSeries property determines whether chart invisible data series must be excluded from calculation. | |
| InnerCircleSize | The InnerCircleSize property determines size of padding between inner border and center of a pie chart. | |
| InnerCircleSizeInPercent | The InnerCircleSizeInPercent property determines a method for setting size of padding between inner border and center of a pie chart. | |
| Inverted | The Inverted property determines whether a chart is inverted. | |
| Is3D | The Is3D property determines whether a 3D chart is displayed. | |
| IsManhattan | The IsManhattan property sets a chart type - 3D chart with groups. | |
| IsMixed | The IsMixed property determines whether a chart is mixed. | |
| LabelsLayer | The LabelsLayer property determines a element that is a rendering layer of chart labels. | |
| Legend | The Legend property determines a chart legend. | |
| LegendFormatter | The LegendFormatter property determines formatting of chart legend labels. | |
| MarkersEnabled | The MarkersEnabled property determines whether chart data series markers are displayed. | |
| MarkersSymbol | The MarkersSymbol property determines a shape of chart data series marker. | |
| Options | The Options property determines chart setting via web service. | |
| PaddingBottom | The PaddingBottom property determines bottom padding of chart. | |
| PaddingLeft | The PaddingLeft property determines left padding of chart. | |
| PaddingRight | The PaddingRight property determines right padding of chart. | |
| PaddingTop | The PaddingTop property determines top padding of chart. | |
| PlotArea | The PlotArea property determines chart rendering area. | |
| Polar | The Polar property determines whether a polar system of coordinates is used on a chart. | |
| Rotation | The Rotation property determines rotation angle of a pie chart. | |
| Scroller | The Scroller property determines a chart scroller. | |
| Selection | The Selection method returns the object containing information about selected chart series elements. | |
| Series | The Series property determines an array of chart data series. | |
| Stacking | The Stacking property determines stacking type on a chart. | |
| Subtitle | The Subtitle property determines parameters of chart subtitle. | |
| Title | The Title property determines chart title parameters. | |
| ToolTip | The ToolTip property determines tooltip parameters. | |
| ToolTipDataFormat | The ToolTipDataFormat property determines tooltip data format. | |
| ToolTipDelay | The ToolTipDelay property determines a delay before a tooltip is displayed. | |
| ToolTipFollowPointer | The ToolTipFollowPointer property determines behavior of a tooltip on moving the mouse cursor. | |
| ToolTipFormatter | The ToolTipFormatter property determines a tooltip text mask. | |
| Type | The Type property determines a chart type. | |
| UseIndicatorColorForToolTipBorder | The UseIndicatorColorForToolTipBorder property determines coloring of tooltip border with series color. | |
| UseMarkersThinning | The UseMarkersThinning property determines whether markers are hidden provided at least some of them overlap each other. | |
| UseSelectOnRightClick | The UseSelectOnRightClick property determines whether chart elements are selected by the right mouse click. | |
| UseSoftPadding | The UseSoftPadding property determines whether alternative calculation of chart paddings is used. | |
| UseZeroSubstitution | The UseZeroSubstitution property determines whether empty values in data series are filled with zeros. | |
| XAxis | The XAxis property determines a chart category axis. | |
| YAxis | The YAxis property determines a chart value axis. | |
| YSAxis | The YSAxis property determines a chart secondary value axis. | |
| ZAxis | The ZAxis property determines a chart height axis. |
| Method name | Brief description | |
| addSerie | The addSerie method adds a new data series to a chart. | |
| beginUpdate | The beginUpdate method disables rerendering of a chart until the endUpdate method is called. | |
| destroy | The destroy method deletes a chart. | |
| endUpdate | The endUpdate method enables chart redrawing and refreshes it. | |
| getChartBounds | The getChartBounds method returns rectangular area of the container, which contains a chart. | |
| getColumnSeriesCount | The getColumnSeriesCount method returns the number of chart data series as columns. | |
| getForecastRange | The getForecastRange method returns the maximum backward and forward forecast for a chart. | |
| getFreeArea | The getFreeArea method returns chart plot area. | |
| getIsCartesianChart | The getIsCartesianChart method returns whether a chart uses Cartesian system of coordinates. | |
| getIsResizing | The getIsResizing method returns whether a chart is being resized. | |
| getPaddings | The getPaddings method returns an object containing chart paddings. |
|
| getPaddingWasApplied | The getPaddingWasApplied method returns an object containing whether chart paddings are applied. | |
| getPieSeriesCount | The getPieSeriesCount method returns the number of data series in a pie chart. | |
| getPlotBorders | The getPlotBorders method returns an object with chart sizes and paddings. | |
| getSerie | The getSerie method returns a chart data series by its index. | |
| getSerieByDataIndex | The getSerieByDataIndex method returns a chart data series by its index. | |
| getSeriesByStackId | The getSeriesByStackId method returns a data series array by a unique stacked chart identifier. | |
| getSeriesStacks | The getSeriesStacks method recalculates all chart stacks for further calculations. | |
| getSeriesTypes | The getSeriesTypes method returns an array of chart series. | |
| getStackExtrems | The getStackExtrems method returns calculated values of chart stacks. | |
| getStackGroups | The getStackGroups method returns the array of unique stacked chart identifiers. | |
| getStats | The getStats method returns chart summary statistics. | |
| getZoom | The getZoom method returns chart zoom options. | |
| hoverItems | The hoverItems method sets highlighting for the specified chart series. | |
| isWidthDataSupported | The isWidthDataSupported method returns whether width and angle indicator is used. | |
| redraw | The redraw method rerenders a chart. | |
| redrawSeries | The redrawSeries method rerenders chart data series. | |
| removeAllSeries | The removeAllSeries method removes all chart data series. | |
| removeSerie | The removeSerie method removes the specified chart data series. | |
| resize | The resize method resizes a chart. | |
| selectItems | The selectItems method selects the specified chart series. | |
| setHeight | The setHeight method sets chart height. | |
| setHoverPoint | The setHoverPoint method sets point selection on a chart. | |
| setInteractivity | The setInteractivity method determines whether a chart is interactive. | |
| setWidth | The setWidth method sets chart width. | |
| updateLegendHighlightMode | The updateLegendHighlightMode method refreshes selection mode in the legend on enabling or disabling of chart editing. |
| Event name | Brief description | |
| Deselected | The Deselected event occurs on deselecting chart element series. | |
| ItemsHovered | The ItemsHovered event occurs on hovering the cursor on a chart series. | |
| ItemsSelected | The ItemsSelected event occurs on selecting a chart series. | |
| ItemsVisibilityChanged | The ItemsVisibilityChanged occurs on changing visibility of chart data series. | |
| PointMouseOut | The PointMouseOut event occurs after the cursor leaves a chart data series point. | |
| PointMouseOver | The PointMouseOver event occurs after hovering the cursor on the chart data series point. | |
| Rendered | The Rendered event occurs on rendering a chart. | |
| Scroll | The Scroll event occurs when the chart X axis is scrolled. | |
| Selected | The Selected event occurs on selecting a chart series element. |
See also: