To execute the example, create an HTML page and perform the following operations:
1. Add a link to CSS file named PP.css. Also add links to the following JS files:
PP.js.
PP.GraphicsBase.js.
PP.Charts_Canvas.js.
resources.ru.js.
2. Within the <head> tag add a style for the block with the "chart" identifier:
<style type="text/css">
    div#chart {
        border: #CCCCCC 1px solid;
        padding: 1px;
        margin: 1px;
        width: 600px;
        height: 500px;
    }
</style>
3. Then within the <head> tag add a script that creates a stacked histogram:
<script>
var chart; // Chart
var currentY = 0;
var isPointEditing = false;
// Creates chart
function createChart() {
    // Create chart
    chart = new PP.Ui.Chart({
        Width: 600, // Chart width
        Height: 500, // Chart height
        ParentNode: "chart",
        Type: "Column", // Chart type
        // X axis
        XAxis: {
            Categories: getCategories(),
            Labels: {
                Enabled: true
            }
        },
        // Y axis
        YAxis: {
            Labels: {
                Enabled: true
            },
            Max: 30,
            Min: -5
        },
        // Y secondary axis
        YSAxis: {
            Enabled: false
        },
        UseZeroSubstitution: true
    });
    // Remove legend
    chart.getLegend().dispose();
    chart.PointMouseOver.add(function(sernder, args) {
        var point = args.Point;
        if (point) {
            point.MouseOver.fire(chart, args);
        }
    })
    chart.PointMouseOut.add(function(sernder, args) {
        var point = args.Point;
        if (point) {
            point.MouseOut.fire(chart, args);
        }
    })
    chart.DblClick.add(function(sender, args) {
        var point = args.Point;
        if (point) {
            point.Click.fire(sender, args);
        }
    });
}
// Returns data series point by identifier
function getChartPointById(id) {
    for (var i in chart.getSeries()) {
        var serie = chart.getSerie(i);
        for (var j in serie.getPoints()) {
            var point = serie.getPoint(j);
            if (point.getId() == id) {
                return point;
            }
        }
    }
    return null;
}
// Removes columns corresponding to data series points with null
function removeNullPoints() {
    // Determine columns being removed
    var removePointsIndexes = getRemovedPoints();
    // Remove columns
    removePoints(removePointsIndexes);
    // Replace columns taking into account removed columns
    movePointsAfterRemoving();
}
// Determines columns being removed
function getRemovedPoints() {
    var removePointsIndexes = [];
    for (var i in chart.getSeries()) {
        var serie = chart.getSeries()[i];
        for (var j = 0; j < serie.getPoints().length; j++) {
            var point = serie.getPoint(j);
            if (j > 0) {
                if (point.getIsAfterNull()) {
                    removePointsIndexes.push(j - 1);
                }
            }
        }
    };
    return removePointsIndexes;
}
// Removes points with specified indexes
function removePoints(points) {
    var serie = chart.getSeries()[0];
    for (var i = 0; i < serie.getPoints().length; i++) {
        if (points.indexOf(i) >= 0) {
            chart.getXAxis().getCategories().splice(i + 1, 1);
            for (var j = 0; j < chart.getSeries().length; j++) {
                chart.getSeries()[j].removePoint(i, true);
            }
        }
    }
}
// Replaces columns taking into account removed columns
function movePointsAfterRemoving() {
    for (var i in chart.getSeries()) {
        var serie = chart.getSeries()[i];
        for (var j = 0; j < serie.getPoints().length; j++) {
            var point = serie.getPoint(j);
            point.setX(j);
        }
    };
}
// Removes specified column of the chart
function removeColumn(index) {
    for (var i in chart.getSeries()) {
        var serie = chart.getSeries()[i];
        serie.removePoint(index - 1, true);
    }
    chart.getXAxis().getCategories().splice(index + 1, 1);
}
// Creates data series for chart
function createSeries() {
    chart.setSeries([createSerie0(), createSerie1()]);
    chart.redraw(true);
}
// Creates the second data series for pie chart
function createSerie0() {
    var serie = new PP.Ui.ChartColumnSerie({
        Index: 0,
        Name: "Brazil", // Series name
        Data: getSerieData0(), // Value array
        Color: getColors()[1],
        Parent: chart,
        Type: "Column"
    });
    return serie;
}
// Creates the first data series for pie chart
function createSerie1() {
    var serie = new PP.Ui.ChartColumnSerie({
        Index: 0,
        LineColor: new PP.SolidColorBrush(),
        Name: "Australia", // Series name
        LineWidth: 2,
        Parent: chart,
        Type: "Column"
    });
    // Add points to the data series
    var point0 = getChartPoint0(serie);
    addPointToSerie(point0, serie);
    addPointToSerie(getChartPoint1(serie), serie);
    addPointToSerie(getChartPoint2(serie), serie);
    addPointToSerie(getChartPoint3(serie), serie);
    addPointToSerie(getChartPoint4(serie), serie);
    // Set point border color
    if (point0.getOriginalLineColorIsRGBA()) {
        serie.getLineColor().setColor(point0.getLineColor());
    };
    return serie;
}
// Adds point to the data series
function addPointToSerie(point, serie) {
    serie.getData().push({
        X: point.getX(),
        Y: point.getY(),
        Name: point.getName(),
        Color: point.getColor(),
        YBottom: point.getStackY(),
    });
    serie.getPoints().push(point);
}
// Creates color array
function getColors() {
    var colors = [
        "#933DA8",
        "#FFD900",
        "#FF9191",
        "#6BBC80",
        "#A0CBC8"
    ];
    return colors;
}
// Returns array category for the X axis
function getCategories() {
    var categories = [];
    for (var i in getSerieData0()) {
        categories.push(getSerieData0()[i].Name);
    }
    return categories;
}
// Returns value array for the second data series
function getSerieData0() {
    var data = [{
        X: 0,
        Y: 1,
        YBottom: 0,
        Name: "2001",
        Color: getColors()[5]
    }, {
        X: 1,
        Y: 2,
        YBottom: 0,
        Name: "2002",
        Color: getColors()[6]
    }, {
        X: 2,
        Y: 3,
        YBottom: 0,
        Name: "2003",
        Color: getColors()[7]
    }, {
        X: 3,
        Y: 5,
        YBottom: 0,
        Name: "2004",
        Color: getColors()[8]
    }, {
        X: 4,
        Y: 10,
        YBottom: 0,
        Name: "2005",
        Color: getColors()[9]
    }];
    return data;
}
// Returns value array for the first data series
function getSerieData1() {
    var data = [{
        X: 0,
        Y: 10,
        YBottom: 1,
        Name: "2001",
        Color: getColors()[0]
    }, {
        X: 1,
        Y: null,
        YBottom: 2,
        Name: "2002",
        Color: getColors()[1]
    }, {
        X: 2,
        Y: 17,
        YBottom: 3,
        Name: "2003",
        Color: getColors()[2]
    }, {
        X: 3,
        Y: 25,
        YBottom: 5,
        Name: "2004",
        Color: getColors()[3]
    }, {
        X: 4,
        Y: 22,
        YBottom: 10,
        Name: "2005",
        Color: getColors()[4]
    }];
    return data;
}
// Returns point for chart data series
function getChartPoint0(serie) {
    var data0 = getSerieData1()[0];
    var chartPoint = new PP.Ui.ChartColumnPoint({
        Color: data0.Color,
        ColorValue: 0.75,
        CustomData: "0",
        Id: "point0",
        EnableEdit: true,
        LineColor: "rgba(195,195,195,1)",
        Name: data0.Name,
        Parent: serie, // Data series to which point belongs
        X: data0.X,
        Y: data0.Y,
        State: "Normal",
        Width: 60,
        StackY: data0.YBottom
    });
    // Refresh point for data
    refreshBeforeRender(chartPoint);
    return chartPoint;
}
// Returns point for chart data series
function getChartPoint1(serie) {
    var data1 = getSerieData1()[1];
    var chartPoint = new PP.Ui.ChartColumnPoint({
        Color: data1.Color,
        ColorValue: 0.75,
        CustomData: "1",
        Id: "point1",
        EnableEdit: false,
        Name: data1.Name,
        Parent: serie, // Data series to which point belongs
        X: data1.X,
        Y: data1.Y,
        TextValue: "Point is set to null",
        Width: 60,
        StackY: data1.YBottom
    });
    // Refresh point for data
    refreshBeforeRender(chartPoint);
    return chartPoint;
}
// Refresh point for chart data series
function getChartPoint2(serie) {
    var data2 = getSerieData1()[2];
    var chartPoint = new PP.Ui.ChartColumnPoint({
        Color: data2.Color,
        ColorValue: 0.75,
        CustomData: "2",
        Id: "point2",
        EnableEdit: true,
        LineColor: data2.Color,
        Name: data2.Name,
        Parent: serie, // Data series to which point belongs
        X: data2.X,
        Y: data2.Y,
        IsSelected: true,
        SizeValue: 10,
        IsAfterNull: true,
        Width: 60,
        StackY: data2.YBottom
    });
    // Refresh point for data
    refreshBeforeRender(chartPoint);
    return chartPoint;
}
// Returns point for chart data series
function getChartPoint3(serie) {
    var data3 = getSerieData1()[3];
    var chartPoint = new PP.Ui.ChartColumnPoint({
        Color: data3.Color,
        ColorValue: 0.75,
        CustomData: "3",
        Id: "point3",
        EnableEdit: false,
        IsFictive: true,
        Name: data3.Name,
        Parent: serie, // Data series to which point belongs
        X: data3.X,
        Y: data3.Y,
        TextValue: "Dummy point",
        Width: 60,
        StackY: data3.YBottom
    });
    // Refresh point for data
    refreshBeforeRender(chartPoint);
    return chartPoint;
}
// Returns point for chart data series
function getChartPoint4(serie) {
    var data4 = getSerieData1()[4];
    var chartPoint = new PP.Ui.ChartColumnPoint({
        Color: data4.Color,
        ColorValue: 0.75,
        CustomData: "4",
        Id: "point4",
        EnableEdit: true,
        IsVisible: false,
        LineColor: data4.Color,
        Name: data4.Name,
        Parent: serie, // Data series to which point belongs
        X: data4.X,
        Y: data4.Y,
        TextValue: "Hidden point",
        Width: 60,
        StackY: data4.YBottom
    });
    // Refresh point for data
    refreshBeforeRender(chartPoint);
    return chartPoint;
}
// Refreshes chart column before its drawing
function refreshBeforeRender(point) {
    // Set up data series point color
    setupPointColor(point);
    // Set up label for data series point
    setupDataLabel(point);
    // Add events to the point
    addEventsHandlerToPoint(point);
}
// Refreshes chart column after its drawing
function refreshAfterRender() {
    for (var i in chart.getSeries()) {
        var serie = chart.getSeries()[i];
        for (var j in serie.getPoints()) {
            var point = serie.getPoints()[j];
            // Set the second coordinate for Y axis columns
            point.setYBottom(point.getStackY(), true);
            // Determine column sizes
            point.setSizeValue({
                Width: point.getWidth(),
                Height: point.getPlotYBottom() - point.getPlotY()
            });
            if (point.getPercentage()) {
                point.setY(point.getPercentage());
            }
            if (point.getPercentPart()) {
                point.setYBottom(point.getPercentPart());
            }
        }
    }
}
// Creates data labels for data series point
function createDataLabels(point) {
    var dataLabel = new PP.Ui.ChartText({
        BackgroundColor: "rgb(255,239,153)",
        BorderWidth: 1,
        Radius: 12,
        Font: new PP.Font(),
        Parent: point.getParent(),
        Text: point.getY()
    });
    point.setDataLabels([dataLabel]);
}
// Sets data label for data series point
function setupDataLabel(point) {
    createDataLabels(point);
    if (point.getDataLabels().length > 0) {
        point.setDataLabel(point.getDataLabels()[0]);
    }
}
// Draws data label for series point
function drawDataLabel(point) {
    var label = point.getDataLabel();
    if (label) {
        label.setLeft(25);
        label.setTop(point.getPlotY());
        label.drawSelf();
    }
}
// Add event handlers to data series point
function addEventsHandlerToPoint(point) {
    // Process the MouseOut event
    point.MouseOut.add(function(sender, args) {
        if (args.Point && args.Point.getDataLabel()) {
            args.Point.getDataLabel().dispose();
            args.Point.setDataLabel(null);
        }
    });
    // Process the MouseOver event
    point.MouseOver.add(function(sender, args) {
        if (args.Point) {
            if (!args.Point.getDataLabel()) {
                setupDataLabel(point);
            }
            drawDataLabel(args.Point);
        };
    });
    // Process the Click event
    point.Click.add(function(sender, args) {
        var point = args.Point;
        console.log("Selected data series point with the %s index", point.getCustomData());
        if (point.getTextValue()) {
            console.log("Point description: %s", point.getTextValue());
        }
        if (point.getSizeValue()) {
            console.log("Sizes of the corresponding column: %s x %s",
                point.getSizeValue().Width,
                point.getSizeValue().Height);
        }
    });
}
// Sets up data series point color
function setupPointColor(point) {
    var opacity = point.getColorValue();
    if (!point.getIsVisible()) {
        opacity = 0;
    }
    if (point.getIsFictive()) {
        opacity = 0.1;
    }
    if (point.getIsSelected()) {
        opacity = 1;
    }
    if (point.getOriginalColorIsRGBA()) {
        point.setColor(new PP.SolidColorBrush({
            Color: point.getColor(),
            Opacity: opacity
        }));
    }
}
// Enables edit mode for data series point
function turnEditMode(isEnabled) {
    chart.getEditMode().setEnabled(isEnabled);
    chart.redraw(true);
}
function onReady() {
    // Create area chart
    createChart();
    // Create data series for the chart
    createSeries();
    // Refresh chart columns after its rendering
    refreshAfterRender();
}
</script>
4. Within the <body> tag specify name of the function creating a stacked histogram as the value of the onLoad attribute, and also add a block with the "chart" identifier:
<body onload="onReady()">
    <div id="chart"></div>
</body>
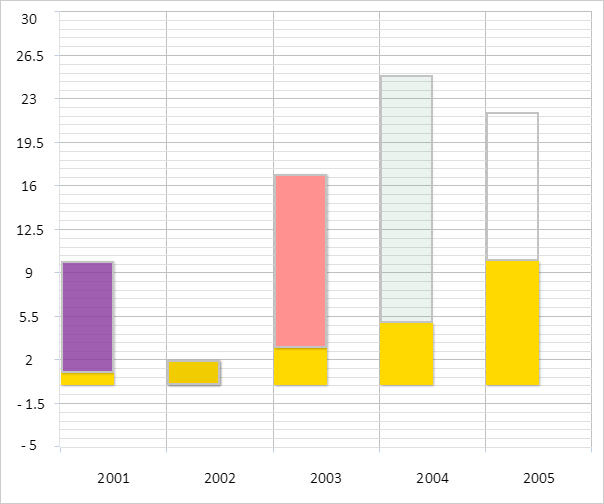
After executing the example a stacked histogram is placed on the HTML page:
The second point in the second chart data series has an empty value, the third point in this series is selected, the fourth one is a dummy point, and the fifth one is invisible.
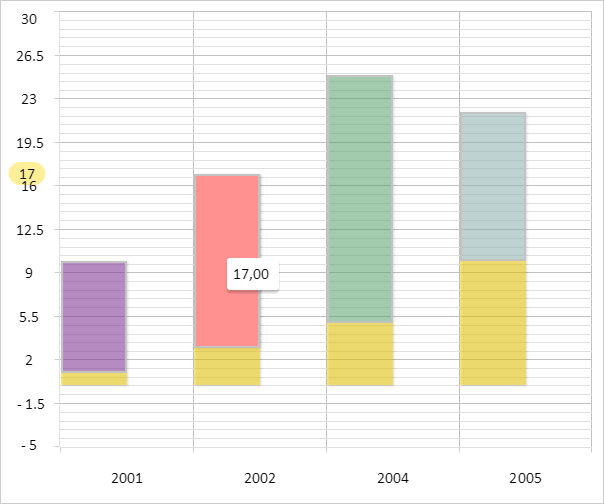
On hovering over any point of the Y axis second series, the tooltip appears containing the point value:
Point information is displayed in the browser console on double clicking any point in the second series. For example, the following data is displayed for the third point:
Data series point with the index 2 is selected
Size of the corresponding column: 52.901119402985074 x 174
Data series point with the index 3 is selected
Point description: Dummy point
Size of the corresponding column: 52.901119402985074 x 248.57142857142856
Allow editing for points of the histogram data serues:
chart.getEditMode().setEnabled(true);
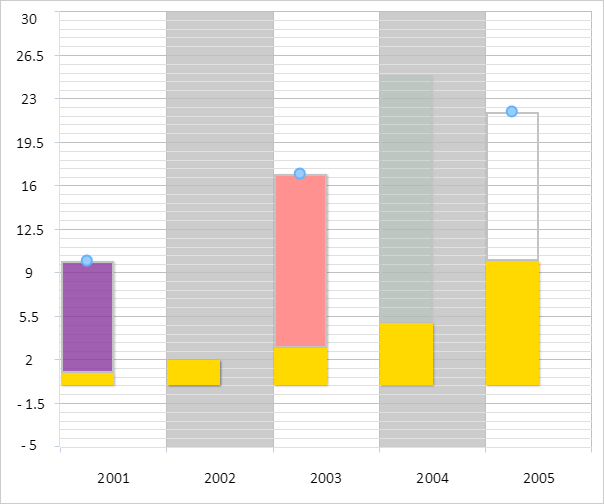
After executing the example edit mode is enabled for histogram points. After clicking on any point in the second series the user gets information that editing is allowed for the first, third and fifth points in this series, while it is not allowed for other points in the series:
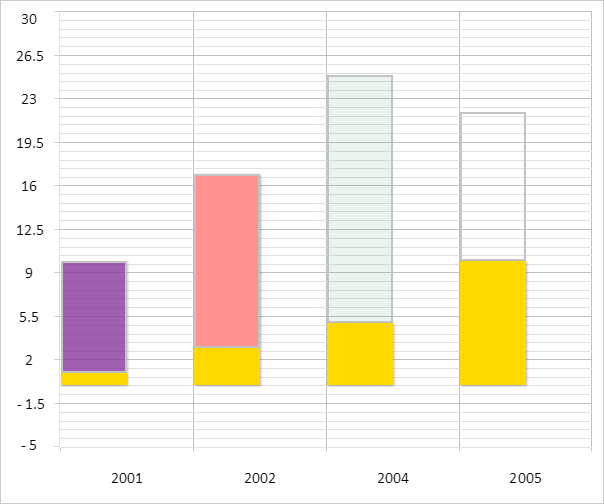
Remove columns that correspond to the chart empty points:
removeNullPoints();
After this the second column in the chart is removed:
See also: