To execute this example, create an HTML page and perform the following operations:
1. Add a link to CSS file named PP.css. Also add links to the following JS files:
PP.js.
PP.GraphicsBase.js.
PP.Charts_Canvas.js.
resources.ru.js.
2. Within the <head> tag add a style for the block with the "chart" identifier:
<style type="text/css">
    div#chart {
        border: #CCCCCC 1px solid;
        padding: 1px;
        margin: 1px;
        width: 600px;
        height: 500px;
    }
</style>
3. Then within the <head> tag add a script that creates an area chart:
<script>
var chart; // Chart
// Creates chart
function createChart() {
    // Create chart
    chart = new PP.Ui.Chart({
        Width: 600, // Chart width
        Height: 500, // Chart height
        ParentNode: "chart",
        Type: "Area", // Chart type
        // X axis
        XAxis: {
            Categories: ["2001", "2002", "2003", "2004", "2005", "2006"],
            Labels: {
                Enabled: true
            }
        },
        // Y axis
        YAxis: {
            Labels: {
                Enabled: true
            },
            Max: 60,
            Min: -10
        },
        // Y secondary axis
        YSAxis: {
            Enabled: false
        }
    });
}
// Creates data series for a chart
function createSeries() {
    var serie = createSerie();
    chart.setSeries([serie]);
    chart.redraw(true);
}
// Creates data series for a chart with areas
function createSerie() {
    var serie = new PP.Ui.ChartAreaSerie({
        Name: "Australia", // Series name
        Data: getSerieData(), // Values array
        Color: getColors()[0], // Color
        LineColor: getColors()[4], // Line color
        Parent: chart,
        Type: "Area"
    });
    var point = getChartAreaPoint(serie);
    // Add a point to the data series
    addPointToSerie(point, serie);
    return serie;
}
// Adds a point to the data series
function addPointToSerie(point, serie) {
    serie.getData().push({
        X: point.getX(),
        Y: point.getY(),
        YBottom: point.getYBottom()
    });
    serie.getPoints().push(point);
}
// Draw data labels for series point
function drawDataLabels() {
    for (var i in chart.getSeries()) {
        var serie = chart.getSerie(i);
        for (var j in serie.getPoints()) {
            var point = serie.getPoints()[j];
            var label = point.getBottomDataLabel();
            if (label) {
                // Determine coordinate of the second value on the X axis
                point.setPlotXBottom(point.getPlotX());
                // Determine label position
                if (point.getTopIsHovered()) {
                    label.setLeft(point.getPlotX());
                    label.setTop(point.getPlotY());
                } else {
                    label.setLeft(point.getPlotXBottom());
                    label.setTop(point.getPlotYBottom());
                }
                label.drawSelf();
            }
        }
    }
}
// Creates color array
function getColors() {
    var colors = ["rgb(192,217,253)", "rgb(163,200,252)", "rgb(134,183,251)",
        "rgb(96,161,250)", "rgb(192,142,204)", "rgb(192,107,188)"
    ];
    return colors;
}
// Display information about chart
function printChartInfo() {
    if (chart.getSeries().length > 0) {
        var serie = chart.getSerie(0);
        if (serie.getIsAreaRange()) {
            console.log("Chart with area and accumulation is displayed");
        } else {
            console.log("Chart with areas is displayed");
        }
        // Determine points included in the array (200, 300)
        var points = serie.getPolyInRange({
            X: 300,
            Y: 0
        }, {
            X: 200,
            Y: 0
        });
        console.log("Points included in the array from 200 to 300:");
        for (var i in points) {
            console.log("(%s, %s)", points[i].X, points[i].Y);
        }
    }
}
// Returns value array for data series
function getSerieData() {
    var data = [{
        X: 0,
        Y: 10,
        YBottom: 5
    }, {
        X: 1,
        Y: 30,
        YBottom: 15
    }, {
        X: 2,
        Y: 17,
        YBottom: -8
    }, {
        X: 3,
        Y: 25,
        YBottom: 12
    }, {
        X: 4,
        Y: 55,
        YBottom: 27
    }];
    return data;
}
// Returns point for chart data series
function getChartAreaPoint(serie) {
    var chartAreaPoint = new PP.Ui.ChartAreaPoint({
        Parent: serie, // Data series to which point belongs
        BottomDataLabel: new PP.Ui.ChartText({
            BackgroundColor: "rgb(255,239,153)",
            BorderWidth: 1,
            Radius: 12,
            Font: new PP.Font(),
            Text: "10",
            Parent: serie
        }), // Tick mark for the second value of the point
        X: getSerieData().length, // Point coordinate on the X axis
        Y: 20, // Coordinate of the first point value on the Y axis
        YBottom: 10, // // Coordinate of the second point value on the Y axis
    });
    //The tick mark for the second point value of data series will be displayed
    chartAreaPoint.setTopIsHovered(false);
    return chartAreaPoint;
}
function onReady() {
    // Create chart with areas
    createChart();
    // Create data series for chart
    createSeries();
    // Draw data tick marks for series points
    drawDataLabels();
    // Display information about chart
    printChartInfo();
}
</script>
4. Within the <body> tag specify name of the function creating a chart as the value of the onLoad attribute, and also add a block with the "chart" identifier:
<body onload="onReady()">
    <div id="chart"></div>
</body>
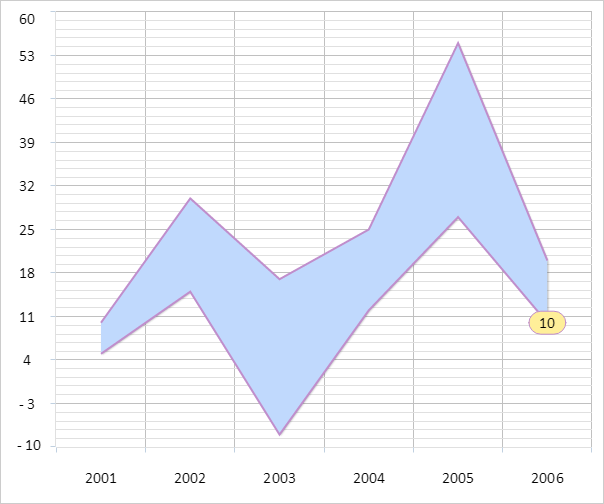
After executing the example area chart is placed on the HTML page:
The browser console shows a message informing on the type of the displayed chart, and also coordinates of the points in the range from 200 to 300:
Stacked area chart is displayed
Points in the range from 200 to 300:
(251.35677083333331, 277.2142857142857)
(251.35677083333331, 432.57142857142856)
See also: