To execute the example, create an HTML page and perform the following operations:
1. Add a link to CSS file named PP.css. Also add links to the following JS files:
PP.js.
PP.GraphicsBase.js.
PP.Charts_Canvas.js.
resources.ru.js.
2. Within the <head> tag add a style for the block with the "chart" identifier:
<style type="text/css">
    div#chart {
        border: #CCCCCC 1px solid;
        padding: 1px;
        margin: 1px;
        width: 300px;
        height: 250px;
    }
</style>
3. Then within the <head> tag add a script that creates a pie chart:
<script>
var chart; // Chart
// Creates pie chart
function createChart() {
    // Create chart
    chart = new PP.Ui.Chart({
        Width: 300, // Chart width
        Height: 250, // Chart height
        Polar: true, // Use polar coordinates
        ParentNode: "chart", // Parent element
        SeriesAsRings: true, // Data series are displayed as rings
        Type: "Pie" // Chart type
    });
}
// Creates data series for chart
function createSeries() {
    chart.setSeries([createSerie1(), createSerie2()]);
    chart.redraw(true);
}
// Creates the first data series for pie chart
function createSerie1() {
    var serie = new PP.Ui.ChartPieSerie({
        Name: "Australia", // Series name
        Data: getSerieData1(), // Values array
        LineColor: getColors()[getColors().length - 1], // Lines color
        Parent: chart,
        Type: "Pie",
        Index: 0 // Series index
    });
    var point = getChartPiePoint(serie);
    // Add point to the data series
    addPointToSerie(point, serie);
    return serie;
}
// Creates the second data series for pie chart
function createSerie2() {
    var serie = new PP.Ui.ChartPieSerie({
        Name: "Brazil", // Series name
        Data: getSerieData2(), // Values array
        LineColor: getColors()[getColors().length - 1], // Lines color
        Parent: chart,
        Type: "Pie",
        Index: 1 // Series index
    });
    return serie;
}
// Adds point to the data series
function addPointToSerie(point, serie) {
    var serieData = serie.getData();
    serieData.push({
        X: point.getX(),
        Y: point.getY(),
        Name: "2006",
        Color: point.getColor()
    });
    serie.setData(serieData);
}
// Creates color array
function getColors() {
    var colors = [
        "rgb(147,61,168)",
        "rgb(255,217,0)",
        "rgb(255,145,145)",
        "rgb(107,188,128)",
        "rgb(160,203,200)",
        "rgb(195,214,108)",
        "rgb(239,193,100)",
        "rgb(239,193,100)",
        "rgb(255,191,191)",
        "rgb(169,216,181)",
        "rgb(205,227,226)",
        "rgb(223,233,178)",
        "rgb(247,223,175)",
    ];
    return colors;
}
// Returns values array for the first data series
function getSerieData1() {
    var data = [{
        X: 0,
        Y: 10,
        Name: "2001",
        Color: getColors()[0]
    }, {
        X: 1,
        Y: 30,
        Name: "2002",
        Color: getColors()[1]
    }, {
        X: 2,
        Y: 17,
        Name: "2003",
        Color: getColors()[2]
    }, {
        X: 3,
        Y: 25,
        Name: "2004",
        Color: getColors()[3]
    }, {
        X: 4,
        Y: 55,
        Name: "2005",
        Color: getColors()[4]
    }];
    return data;
}
// Returns values arrays for the second data series
function getSerieData2() {
    var data = [{
        X: 0,
        Y: 15,
        Name: "2001",
        Color: getColors()[5]
    }, {
        X: 1,
        Y: 24,
        Name: "2002",
        Color: getColors()[6]
    }, {
        X: 2,
        Y: 19,
        Name: "2003",
        Color: getColors()[7]
    }, {
        X: 3,
        Y: 29,
        Name: "2004",
        Color: getColors()[8]
    }, {
        X: 4,
        Y: 28,
        Name: "2005",
        Color: getColors()[9]
    }];
    return data;
}
// Displays information about chart
function printChartInfo() {
    for (var i in chart.getSeries()) {
        var serie = chart.getSerie(i);
        if (serie.getPoints().length > 0) {
            var point = serie.getPoints()[i];
            console.log("Information about the %s data series:", serie.getName());
            console.log("  Start angle of the first sector: %s", point.getStartAngle());
            console.log("  End angle of the first sector: %s", point.getEndAngle());
            console.log("  Outer radius if the doughnut: %s", point.getRadius());
            console.log("  Inner radius of the doughnut: %s", point.getInnerRadius());
        }
    }
}
// Returns point for the chart data series
function getChartPiePoint(serie) {
    var chartPiePoint = new PP.Ui.ChartPiePoint({
        Parent: serie, // Data series to which point belongs
        X: getSerieData1().length,
        Y: 75,
        Color: getColors()[6]
    });
    chartPiePoint.setInnerRadius(30);
    return chartPiePoint;
}
function onReady() {
    // Create pie chart
    createChart();
    // Create data series for chart
    createSeries();
    // Display information about chart
    printChartInfo();
}
</script>
4. Within the <body> tag specify name of the function creating a chart as the value of the onLoad attribute, and also add a block with the "chart" identifier:
<body onload="onReady()">
    <div id="chart"></div>
</body>
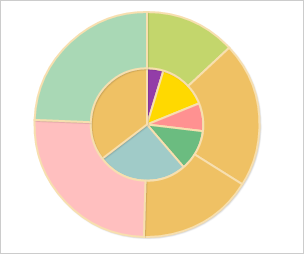
After executing the example a pie chart is placed on the HTML page:
The browser console shows information about two chart data series:
Information on the Australia data series:
Start angle of the first sector: 4.71238898038469
End angle of the first sector: 5.0087656458176895
Outer radius of the doughnut: 56.25
Inner radius of the doughnut: 0
Information on the Brazil data series:
Start angle of the first sector: 5.531934890016809
End angle of the first sector: 0.5600230382486151
Outer radius of the doughnut: 112.5
Inner radius of the doughnut: 56.25
See also: