Before executing the example, study the recommendations for code writing.
To create a linear chart, use HTML code:
<!DOCTYPE html PUBLIC "-//W3C//DTD XHTML 1.0 Transitional//EN" "http://www.w3.org/TR/xhtml1/DTD/xhtml1-transitional.dtd">
<html>
<head>
<meta http-equiv="X-UA-Compatible" content="IE=edge" />
<meta http-equiv="Content-Type" content="text/html; charset=UTF-8">
<title>Chart_Line</title>
<script src="../build/PP.js" type="text/javascript"></script>
<script src="../build/PP.GraphicsBase.js" type="text/javascript"></script>
<script src="../build/PP.Charts.js" type="text/javascript"></script>
<script src="../build/PP.Charts_Canvas.js" type="text/javascript"></script>
<link href="../build/PP.css" rel="stylesheet" type="text/css" />
<script src="../resources/PP.resources.ru.js" type="text/javascript"></script>
<style type="text/css">
div#chart {
border: #CCCCCC 1px solid;
padding: 1px;
margin: 1px;
width: 450px;
height: 400px;
}
</style>
<script type="text/javascript">
var chart;
// Create a chart
function createChart() {
// Line chart
chart = new PP.Ui.Chart({
MarkersEnabled: true, // Display markers for data series
Width: 450, // Chart width
Height: 400, // Chart height
ParentNode: "chart",
Type: "Line", // Chart type
// X axis
XAxis: {
Categories: ["2001", "2002", "2003", "2004", "2005", "2006", "2007"],
IsX: true,
Labels: {
Enabled: true
}
},
// Secondary Y axis
YSAxis: {
Enabled: false
}
});
}
//Returns marker for chart data series
function getMarker(borderColor) {
var marker = {
BorderColor: borderColor,
BorderWidth: 2,
Color: "rgb(255, 255, 255)",
Enabled: chart.getMarkersEnabled(),
Radius: 8,
Symbol: chart.getMarkersSymbol(),
};
return marker;
}
// Creates a colors array
function getColors() {
var colors = [
"rgb(147,61,168)",
"rgb(255,217,0)",
"rgb(255,145,145)",
"rgb(107,188,128)",
"rgb(160,203,200)",
"rgb(195,214,108)",
"rgb(239,193,100)",
"rgb(239,193,100)",
"rgb(255,191,191)",
"rgb(169,216,181)",
"rgb(205,227,226)",
"rgb(223,233,178)",
"rgb(247,223,175)",
];
return colors;
}
// Creates chart data series
var serie1, serie2;
function createSeries() {
chart.setSeries([serie1 = createSerie1(), serie2 = createSerie2()]);
chart.redraw(true);
}
// Creates the first data series for line chart
function createSerie1() {
var serie = new PP.Ui.ChartCanvasSerie({
Click: onClick,
Color: getColors()[0],
CustomData: "Series 1",
Data: getSerieData1(), // Series data
DataIndex: 0, // Data series index
DataLabels: getDataLabels(),
Editable: false, // Series data must not be edited
Id: "Serie0",
IsMasterSerie: true, // Specify that data series is forecasting one
LinePenEnabled: true, // Enable to display series lines
MasterSerieIdx: 0, // Forecasting series index
Marker: getMarker(getColors()[0]), // Marker for chart data series
Name: "Australia", // Series name
LineColor: getColors()[4], // Line color
OnContextMenu: onContextMenu,
Parent: chart,
ParentSerieIndex: -1, // This data series is parent one
Threshold: '0', // Start Y axis counting from 0
Type: "Line",
});
return serie;
}
// Creates the second data series for line chart
function createSerie2() {
var serie = new PP.Ui.ChartCanvasSerie({
Click: onClick,
Color: getColors()[1],
CustomData: "Series 2",
DataIndex: 1, // Data series index
DataLabels: getDataLabels(),
Editable: true, // Series data can be edited
Data: getSerieData2(), // Values array
Id: "Serie1",
LinePenEnabled: false,
Marker: getMarker(getColors()[1]), // Marker for chart data series
Name: "Brazil", // Series name
LineColor: getColors()[5], // Line color
OnContextMenu: onContextMenu,
Parent: chart,
ParentSerieIndex: 0, // Parent data series index
Threshold: '0',
Type: "Line"
});
// Set legend text for this series
serie.setLegendText(serie.getCustomData() + ": " + serie.getName());
serie.setLegendTextWidth(5);
return serie;
}
// Returns values array for the first data series
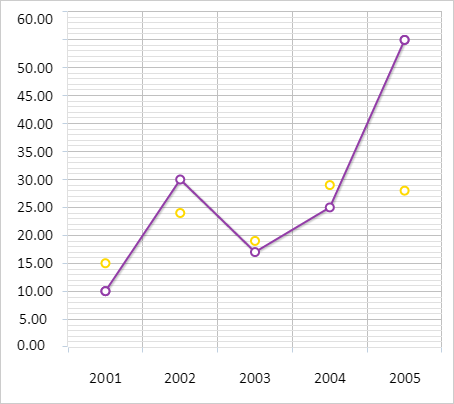
function getSerieData1() {
var data = [{
X: 0,
Y: 10,
Name: "2001",
Color: getColors()[0]
}, {
X: 1,
Y: 30,
Name: "2002",
Color: getColors()[1]
}, {
X: 2,
Y: 17,
Name: "2003",
Color: getColors()[2]
}, {
X: 3,
Y: 25,
Name: "2004",
Color: getColors()[3]
}, {
X: 4,
Y: 55,
Name: "2005",
Color: getColors()[4]
}];
return data;
}
// Returns values array for the second data series
function getSerieData2() {
var data = [{
X: 0,
Y: 15,
Name: "2001",
Color: getColors()[5]
}, {
X: 1,
Y: 24,
Name: "2002",
Color: getColors()[6]
}, {
X: 2,
Y: 19,
Name: "2003",
Color: getColors()[7]
}, {
X: 3,
Y: 29,
Name: "2004",
Color: getColors()[8]
}, {
X: 4,
Y: 28,
Name: "2005",
Color: getColors()[9]
}];
return data;
}
// Handles data series point click
function onClick(sender, args) {
if (args && args.Point) {
if (args.Point.getParent().checkPointOnPlot(args.Point)) {
console.log("Point with the %s value is selected in chart plot area",
args.Point.getY());
} else {
console.log("Point with the %s value is selected outside chart plot area",
args.Point.getY());
}
};
}
// Handles context menu call for data series point
function onContextMenu(sender, args) {
if (args && args.Point) {
printSerieInfo(args.Point.getParent());
}
}
// Returns data labels for data series points
function getDataLabels() {
var options = {
BackgroundColor: "rgb(255,239,153)",
BorderColor: "transparent",
BorderWidth: 1,
Font: new PP.Font(),
Radius: 0
};
return options;
}
// Displays information about specified data series
function printSerieInfo(serie) {
if (serie) {
// Determine whether series is forecasting one
if (serie.getIsMasterSerie()) {
console.log("Data series is forecasting one and has the %s index",
serie.getMasterSerieIdx());
} else {
console.log("Data series is not forecasting one");
}
console.log("Data series %s is selected", (serie.getIsSelected() ? "" : "is not "));
console.log("Data series %s is highlighted", (serie.getHighlighted() ? "" : "is not "));
if (serie.getState === "Hover") {
console.log("Data series is hovered");
} else {
console.log("Data series is not hovered");
}
}
}
function onReady() {
// Create a line chart
createChart();
// Create chart data series
createSeries();
// Rerender chart
chart.redraw(true);
}
</script>
</head>
<body onload="onReady()">
<div id="chart"></div>
</body>
</html>
After executing the example the Chart component is placed on the HTML page as linear chart with two data series:
See also: