To execute the example, create an HTML page and perform the following operations:
1. Add a link to CSS file named PP.css. Also add links to the following JS files:
PP.js.
PP.GraphicsBase.js.
PP.Charts_Canvas.js.
resources.ru.js.
2. Within the <head> tag add a style for the block with the "chart" identifier:
<style type="text/css">
    div#chart {
        border: #CCCCCC 1px solid;
        padding: 1px;
        margin: 1px;
        width: 450px;
        height: 400px;
    }
</style>
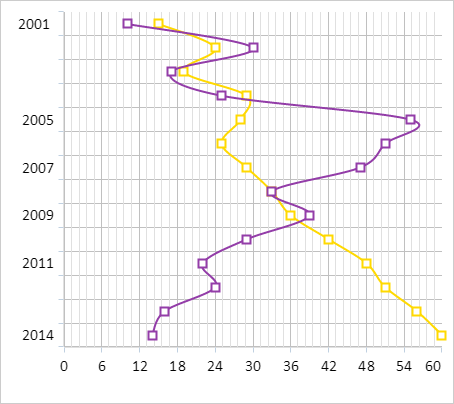
3. Then within the <head> tag add a script that creates an inverted spline chart with markers:
<script>
var chart;
// Create a chart
function createChart() {
    // Create spline chart
    chart = new PP.Ui.Chart({
        Width: 450, // Chart width
        Height: 400, // Chart height
        ParentNode: "chart",
        Type: "Spline", // Chart type
        // X axis
        XAxis: {
            Categories: ["2001", "2002", "2003", "2004", "2005", "2006",
                "2007", "2008", "2009", "2010", "2011", "2012", "2013", "2014"
            ],
            Labels: {
                Enabled: true
            }
        },
        //Y axis
        YAxis: {
            Labels: {
                Enabled: true
            },
            Max: 60,
            Min: 0
        },
        // Additional Y axis
        YSAxis: {
            Enabled: false
        },
        Inverted: true, // Inverted chart
        MarkersEnabled: true, // Display markers for data series
        MarkersSymbol: "square" // Display markers as rectangles
    })
}
// Create data series for spline chart
function createSeries() {
    chart.setSeries([createSerie1(), createSerie2()]);
    chart.redraw(true);
}
// Returns marker for chart data series
function getMarker(borderColor) {
    var marker = {
        BorderColor: borderColor,
        BorderWidth: 2,
        Color: "rgb(255, 255, 255)",
        Enabled: chart.getMarkersEnabled(),
        Radius: 8,
        Symbol: chart.getMarkersSymbol(),
    };
    return marker;
}
// Creates the first data series for spline chart
function createSerie1() {
    var serie = new PP.Ui.ChartSplineSerie({
        Data: getSerieData1(),
        Name: "Australia", // Series name
        Color: getColors()[0],
        LineColor: getColors()[4], // Line color
        Marker: getMarker(getColors()[0]), // Marker for chart data series
        Parent: chart,
        Type: "Spline",
    });
    return serie;
}
// Creates the second data series for spline chart
function createSerie2() {
    var serie = new PP.Ui.ChartSplineSerie({
        Name: "Brazil", // Series name
        Data: getSerieData2(), // Values array
        Color: getColors()[1],
        LineColor: getColors()[5], // Line color
        Marker: getMarker(getColors()[1]), // Marker for chart data series
        Parent: chart,
        Type: "Spline"
    });
    return serie;
}
// Create color array
function getColors() {
    var colors = [
        "rgb(147,61,168)",
        "rgb(255,217,0)",
        "rgb(255,145,145)",
        "rgb(107,188,128)",
        "rgb(160,203,200)",
        "rgb(195,214,108)",
        "rgb(239,193,100)",
        "rgb(239,193,100)",
        "rgb(255,191,191)",
        "rgb(169,216,181)",
        "rgb(205,227,226)",
        "rgb(223,233,178)",
        "rgb(247,223,175)",
    ];
    return colors;
}
// Returns array of values for the first data series
function getSerieData1() {
    var data = [{
        X: 0,
        Y: 10,
        Name: "2001",
        Color: getColors()[0]
    }, {
        X: 1,
        Y: 30,
        Name: "2002",
        Color: getColors()[1]
    }, {
        X: 2,
        Y: 17,
        Name: "2003",
        Color: getColors()[2]
    }, {
        X: 3,
        Y: 25,
        Name: "2004",
        Color: getColors()[3]
    }, {
        X: 4,
        Y: 55,
        Name: "2005",
        Color: getColors()[4]
    }, {
        X: 5,
        Y: 51,
        Name: "2006",
        Color: getColors()[0]
    }, {
        X: 6,
        Y: 47,
        Name: "2007",
        Color: getColors()[1]
    }, {
        X: 7,
        Y: 33,
        Name: "2008",
        Color: getColors()[2]
    }, {
        X: 8,
        Y: 39,
        Name: "2009",
        Color: getColors()[3]
    }, {
        X: 9,
        Y: 29,
        Name: "2010",
        Color: getColors()[4]
    }, {
        X: 10,
        Y: 22,
        Name: "2011",
        Color: getColors()[0]
    }, {
        X: 11,
        Y: 24,
        Name: "2012",
        Color: getColors()[1]
    }, {
        X: 12,
        Y: 16,
        Name: "2013",
        Color: getColors()[2]
    }, {
        X: 13,
        Y: 14,
        Name: "2014",
        Color: getColors()[3]
    }];
    return data;
}
// Returns array of values for the second data series
function getSerieData2() {
    var data = [{
        X: 0,
        Y: 15,
        Name: "2001",
        Color: getColors()[5]
    }, {
        X: 1,
        Y: 24,
        Name: "2002",
        Color: getColors()[6]
    }, {
        X: 2,
        Y: 19,
        Name: "2003",
        Color: getColors()[7]
    }, {
        X: 3,
        Y: 29,
        Name: "2004",
        Color: getColors()[8]
    }, {
        X: 4,
        Y: 28,
        Name: "2005",
        Color: getColors()[9]
    }, {
        X: 5,
        Y: 25,
        Name: "2006",
        Color: getColors()[0]
    }, {
        X: 6,
        Y: 29,
        Name: "2007",
        Color: getColors()[1]
    }, {
        X: 7,
        Y: 33,
        Name: "2008",
        Color: getColors()[2]
    }, {
        X: 8,
        Y: 36,
        Name: "2009",
        Color: getColors()[3]
    }, {
        X: 9,
        Y: 42,
        Name: "2010",
        Color: getColors()[4]
    }, {
        X: 10,
        Y: 48,
        Name: "2011",
        Color: getColors()[0]
    }, {
        X: 11,
        Y: 51,
        Name: "2012",
        Color: getColors()[1]
    }, {
        X: 12,
        Y: 56,
        Name: "2013",
        Color: getColors()[2]
    }, {
        X: 13,
        Y: 60,
        Name: "2014",
        Color: getColors()[3]
    }];
    return data;
}
// Update markers of chart data series
function updateChartMarkers() {
    for (var i in chart.getSeries()) {
        var serie = chart.getSeries()[i];
        // Get settings of chart data series
        var states = serie.getStates();
        states.Normal.Marker.Enabled = chart.getMarkersEnabled();
        states.Normal.Marker.Symbol = chart.getMarkersSymbol();
    }
    // Update chart data series
    chart.redrawSeries(true);
}
// Sets markers size for data series
function setMarkersRadius(radius) {
    for (var i in chart.getSeries()) {
        var serie = chart.getSeries()[i];
        serie.getMarker().Radius = radius;
    }
    // Update chart data series
    chart.redrawSeries(true);
}
function onReady() {
    // Create spline chart
    createChart();
    // Create data series for the chart
    createSeries();
    // Re-render the chart
    chart.redraw(true);
}
</script>
4. Within the <body> tag specify name of the function creating a chart as the value of the onLoad attribute, and also add a block with the "chart" identifier:
<body onload="onReady()">
    <div id="chart"></div>
</body>
After executing the example the inverted spline chart with rectangle-shaped markers is placed on the HTML page:
See also: