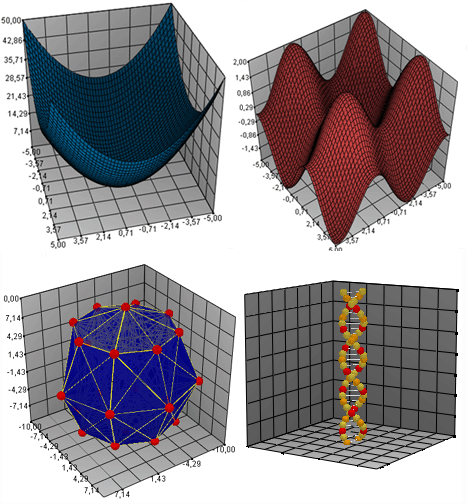
A 3D scene is used to visualize data sets as various multidimensional objects: simple and closed surfaces, spheres (points) and groups of named spheres:

To add a 3D scene to a report sheet:
Specify the cell range to house the scene.
Select the Others > 3D Scene item in the Charts group of the Insert ribbon tab.
In the 3D Scene Data Sources dialog box specify initial data of the 3D scene.
The following operations are available when working with a 3D scene:
The following operations become available after a 3D scene is activated:
See also:
Getting Started with the Reports Tool in the Web Application | Data Visualization as Charts