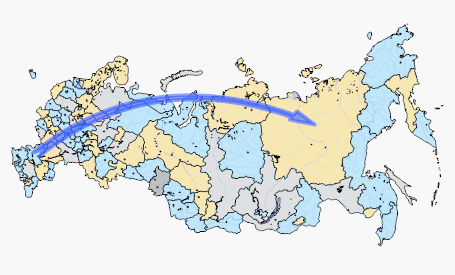
An arrow is used to visualize direction of movement of any streams between areas, for example:
Regular report enables simplified creating of arrows: it is required to have a map and a data source with one territory dimension, which meets basic requirements.
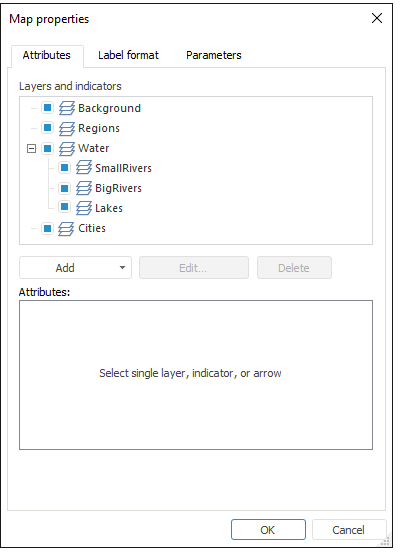
To create, set up and remove arrows, use the Attributes tab in the Map Properties dialog box.

Example of arrow between areas:

See also:
Getting Started with the Reports Tool in the Web Application | Map Features in Regular Report