
 To display the tab
Gap setup enables the user to regulate distance between series and its position relative to each other on the chart.
NOTE. Setting up gaps between series is only available for histogram, 3D histogram with groups, waterfall chart and mixed chart, containing series of the Column type.
The following methods can be used to set up gaps between series:
Quick setup. Use the 3D View and Gaps tab on the side panel.
Advanced setup. Use the Advanced tab in the Chart Parameters dialog box.
The chart appearance with various gap settings between series is given in the Examples of Various Gaps between Series Settings section.
To quickly set up gaps between series, use the 3D View and Gaps side panel tab.
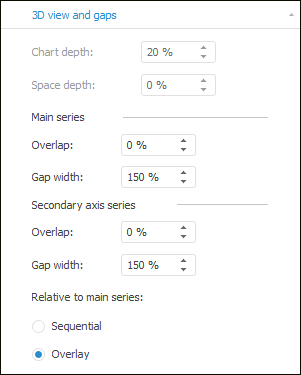
Settings are divided into the following groups: Main Series, Secondary Axis Series and are used to set up main series and secondary axis series respectively.
NOTE. The Secondary Axis Series settings group is displayed only if the chart contains series built on secondary axis. To build rows on a secondary axis, use the Data Series side panel tab.
Set the following parameters:
Size of the gap width between series
Secondary axis series position relative to main series
NOTE. Overlap and gap width settings for secondary axis series are applied, if series overlap main series.
For advanced setup of gaps between series, use the Advanced tab in the Chart Parameters dialog box.
Settings are divided into the following groups: Main Series, Secondary Axis Series and are used to set up main series and secondary axis series respectively.
Set the following parameters:
NOTE. Series overlap and gap width are adjusted similarly to setting up these parameters using the 3D View and Gaps side panel tab.
Using rounded columns. To display chart series as rounded columns, select the Use Column Rounding checkbox.
NOTE. The checkbox is disabled if a chart is displayed in 3D.
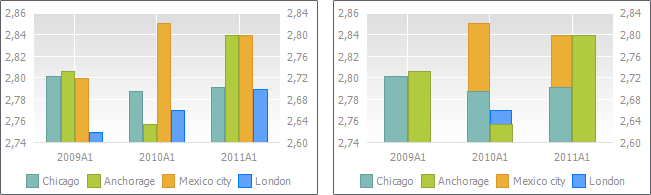
Example of the histogram with gap width for main series 50 (left) and 200 (right):
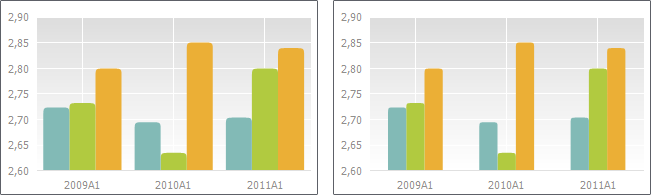
Example of the histogram with overlap for main series -50 (left) and 50 (right):
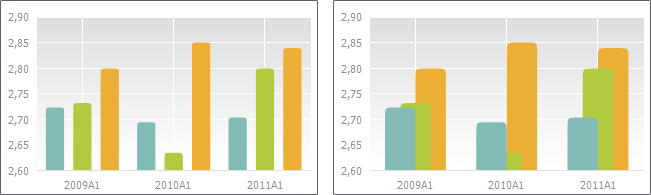
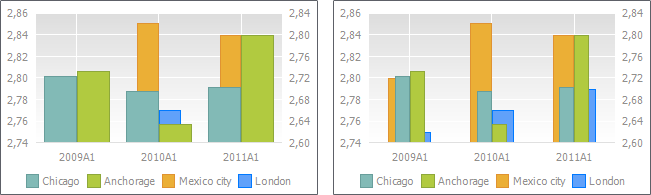
Example of the histogram where main series and secondary axis series are placed sequentially (left) and where secondary axis series overlap main series (right). Mexico City and London are main series, Chicago and Anchorage are secondary axis series:
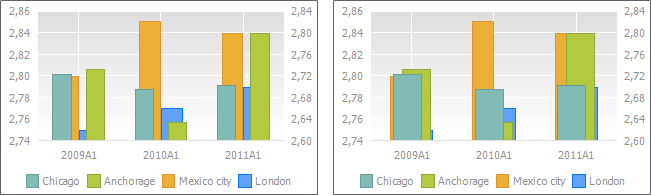
Example of the histogram with gap width for secondary axis series 50 (left) and 350 (right). Mexico City and London are main series, Chicago and Anchorage are secondary axis series:
Example of the histogram with overlap for the secondary axis series -70 (left) and 70 (right). Mexico City and London are main series, Chicago and Anchorage are secondary axis series:
See also:
Setting Up 3D View and Gaps | Chart Types | Setting Up General Chart Parameters