
 Open the Overlaps and Gaps group of parameters
Overlaps and gaps setup can be used for adjusting the distance between series and their position relative to each other on the chart.
To set up overlaps and gaps, use the Overlaps and Gaps group of parameters on the side panel.
Open the Overlaps and Gaps group of parameters
NOTE. Displayed parameters depend on the chart type.
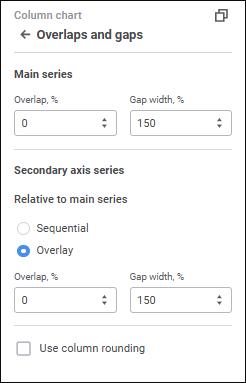
Set the parameters:
It is available for histograms with absolute values, stacked histograms with groups, mixed charts with absolute values if there are series of the Bar type.
The parameter determines position of series relative to each other. Set overlap value in percents. If value is positive, the series are overlapped, if negative, there will be a gap between series. The default value is 0. Available values range: [-100; 100].
It is available for all histogram types, all mixed chart types, if there are series of the Bar type, waterfall charts, box charts, box charts with linear series.
The parameter determines the distance between series in chart's neighbor points. Set gap width value in percents. The default value is 150%. The range of available values: [0, 500].
It is available for all histogram types and for all mixed chart types if there are series of the Bar type.
To select series overlay option on the secondary axis in the Relative to Main Series group, select the radio button:
Sequential. Main series and secondary axis series are placed sequentially.
Overlay. Secondary axis series overlay the main series. Default value.
When the Overlay secondary series position option is selected, the Overlap and Gap Width options become available. Available parameters depend on whether the same parameters are available for the main series.
It is available for 2D histograms, 2D mixed charts if there are series of the Bar type, and for waterfall charts.
The parameter determines whether chart series are displayed as rounded columns. Select the Use Column Rounding checkbox to enable this option.
It is available for pie charts, 3D pie charts, and doughnut charts.
The parameter determines the distance between chart series. Set gap value in millimeters. The default value is 0. The range of available values: [0, 100].
It is available for doughnut charts.
The parameter determines hold diameter size relative to chart diameter. Set value in percents. The default value is 50%. The range of available values: [10%, 90%].
It is available for pie charts, 3D pie charts, and doughnut charts.
The parameter determines rotation angle of the central axis in degrees. The chart is rotated clockwise. Set value in degrees. The default value is 0. The range of available values: [0, 360].
See also:
 Parameters button on the toolbar, then select the required group.