A level line is a line in the chart plot area that is perpendicular to the specified axis.
NOTE. Level line setup is available for all 2D chart types, except for pie charts.
To set up level lines, use the Level Lines group of parameters on the side panel.
 To open the Level Lines group of parameters
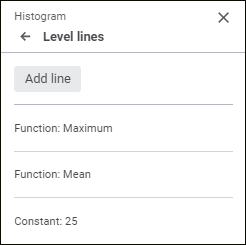
The group of parameters contains the added level lines with names in the format: <level line creation method>:<value>.
To add a level line:
Click the Add Line button. A level line will be added with default settings.
Double-click the level line. The set of parameters opens:
Set the parameters:
to delete level line, click the  Delete button next to the level line name and displayed on level line mouseover.
NOTE. The chart plot area is also built from level lines. To set up main level lines in the plot area, use the Gridlines section in the Value Axis group of parameters on the side panel.
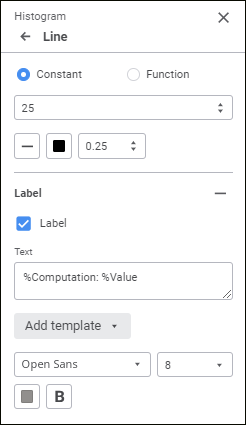
To build a level line, select one of the radio buttons:
Constant. Set permanent level line value by using the keyboard or value editor.
Function. In the drop-down list select the function, which value will be used to build a level line. The following function types are available: Maximum, Minimum, Sum, Median, or Mean.
If required, set up level line display parameters:
Line Type. Select a line type in the drop-down list.
Line Color. Select line color in the drop-down palette. One can select standard and custom colors. The palette contains only standard colors by default.
To create a custom color:
Click the  Add Color button. The advanced color palette opens.
Select a color in the advanced color palette, use color picker to select color on a browser page, or set color code in the RGB or HEX format.
After executing the operations the custom color is created and added to the palette.
NOTE. The maximum possible number of custom colors in the a palette is 23.
To delete custom color from the palette, select the Delete item in the selected color's context menu.
Line Width. Set line width in points using the keyboard or the value editor. The range of available values: [0, 10].
After executing the operations, a level line is built on a chart according to the specified parameters.
To show a level line label, select the Label checkbox. The checkbox is deselected by default.
A custom text, template can be set for the label, or combination of both. To enter text and templates, use the Text box.
To add a template to the label text:
Click the Add Template button.
In the drop-down list select one of the available text templates:
%Computation. Level line building method: Constant or Function.
%Value. Level line value.
After executing the operations the selected template will be added to the label text.
To set up level font:
Font. In the drop-down list select one of the available fonts. If required, one can load custom fonts.
Font size. In the drop-down list select font size in points. The range of available values: [6; 36].
Color. Select font color in the drop-down palette. One can select standard and custom colors. The palette contains only standard colors by default.
To create a custom color:
Click the Add Color button. The advanced color palette opens.
Select a color in the advanced color palette, use color picker to select color on a browser page, or set color code in the RGB or HEX format.
After executing the operations the custom color is created and added to the palette.
NOTE. The maximum possible number of custom colors in the a palette is 23.
To delete custom color from the palette, select the Delete item in the selected color's context menu.
Style. Select font style:
B. Bold.
I. Italic.
U. Underline.
When the button is pressed, the corresponding font style is used. Several styles can be used simultaneously, for example, pressed B and I buttons result in bold italic font style.
After executing the operations the specified font options will be applied to the label text.
See also:

 Parameters button on the toolbar, then select the required group.