In this article:
Working with Table Data
View mode provides the following operations with table data:
Sorting and Filtering
Data sorting and filtering in columns is available both on a report sheet and in a data table.
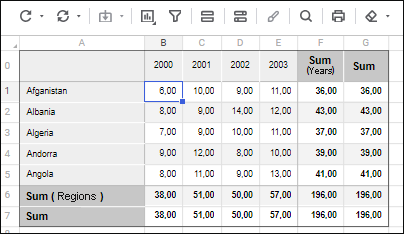
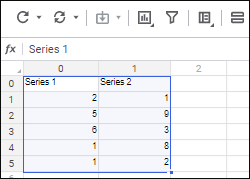
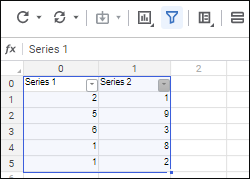
Data sorting and filtering in columns on a report sheet is executed by means of the  Filtering Settings button in column headers. Data filtering for a data table is set up by means of the Filtering Settings button.

 Filter button on the Home toolbar tab. The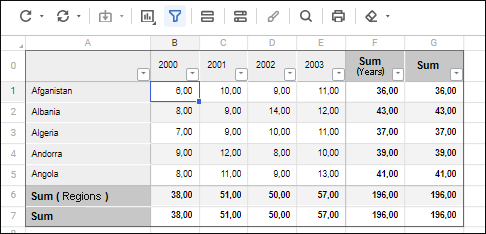
Sorting
Range sorting allows for quick sorting the selected range in a regular report sheet.
 . Ascending.
 . Descending.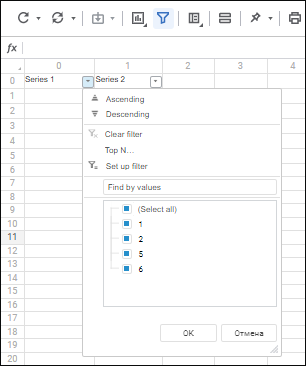
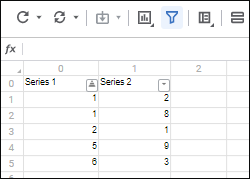
Data sorting in the table is available if it was set up on editing.
Filtering
Filtering is a method of finding a data subset and working with this data in the list. A filtered list shows only the rows that satisfy the conditions set for the given column. The rows that do not satisfy the filter condition, are hidden.
Filtering in a regular report can be set up for:
Table data.
Sheet range.
A report sheet allows for setting up only filtering for one range or one table.
 Filter data range on report sheet or table
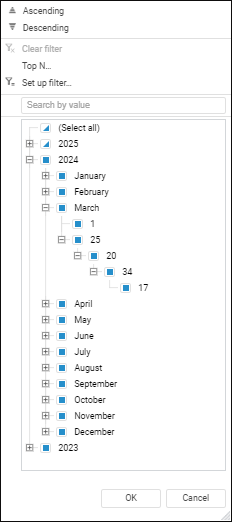
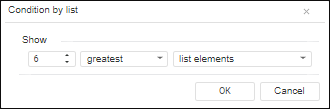
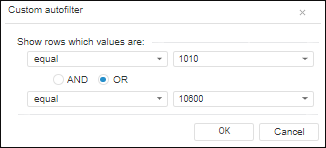
 .
. Clear Filter item for the column in the drop-down menu of the
 When data range autofilter is used on a report sheet or table visualizer sheet:
Value of one cell is pasted to a cell range only in visible rows/columns.
Value range paste is applied to all visible rows/columns. The inserted value range is extended taking into account copy area size including hidden rows/columns.
Cutting value range to clipboard is applied to all rows/columns during filtering regardless of their visibility. Copying value range to clipboard is applied only to visible rows/columns.
Data deletion is applied only to visible rows/columns.
Behavior will be identical for the entire data range regardless of filter position.
Editing and Saving
To edit cell contents:
Select a cell in the report sheet and enter required data.
Double-click the selected cell.
When data range filtering is applied on a report sheet or table sheet, data clearing is applied only to visible rows/columns.
It is impossible to edit values that cannot be written to the source:
To indicate whether cells are locked for editing, one can use icons. For details see the Displaying Icons in Cells article.
Features of Displaying Values in Aggregated Cells
If a cube with configured aggregation and selected Do not Aggregate Different Measurement Units checkbox is used as a data source, and elements with different measurement units are selected, the aggregated cell will display the "-" character instead of the value. To change character or display text, use the IPivot.UnmatchedUnitsText property.
The character is also displayed during calculation of totals and aggregation of fixed dimensions.
When displaying of icons for calculated cells is enabled, the aggregated cell will display both characters. The =- characters are displayed by default.
Saving Changed Data to Source and Undoing Changes
Saving data is available for:
Report.
Sheet.
 Save Data > Save Report Data button on the Home or Data toolbar tab.
Undo report data and sheet changes
 Undo Changes on the Home or Data toolbar tab.
Changed data can be saved to the following types of sources: standard cube, cube view, virtual cube, modeling variables.
If during report saving changed values was not saved, it is prompted to save it. If the answer is positive, report data is saved.