 Scales button in the Tools and Panels group on the View ribbon tab. The Report Scales dialog box opens:
To work with the tool in Foresight Analytics Platform 10, use the new interface.
Report scales are the rules for formatting various indicators in regular report maps depending on the selected data.
Report scales are used in regular report to set up displaying attributes for indicators in map mode. A created scale links to a map indicator, and after the report calculation the map is formatted following the rules specified in the scale. Each scale determines a set of numeric intervals and maps them to a formatting depending on the type.
The following kinds of scale are used in reports:
Color scale. Maps color to a range of values. It is used to set up the Fill attribute for map indicators.
Hatching scale. Maps a hatching to a range of values. It is used to set up the Hatching attribute for map indicators.
Numeric scale. Maps radiuses and heights of chart sectors to map parts. It is used in pie and map indicators to determine radius and height of the map sectors or bars respectively.
To work with report scales, click the Scales button in the Tools and Panels group on the View ribbon tab. The Report Scales dialog box opens:
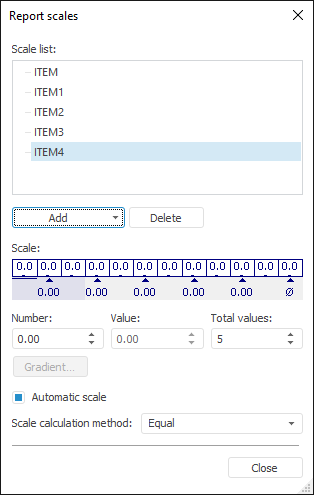
In the dialog box that opens select a report scale in the list of available scales, or add new scales.
To add a new scale, click the Add button. A drop-down list of scale types opens.
To remove the selected scale, click the Remove button.
See also: