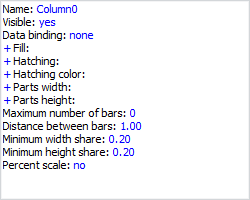
Map bar indicators are set up on the Attributes tab in the Map Properties dialog box.
Select the required bar indicator in the Layers and Indicators list. The Attributes area looks as follows:

Set bar indicator parameters:
Name. To set indicator name, click the hyperlink with default name. Enter the indicator name to the edit box at the bottom part of the Map Properties dialog box.
Visible. To display the indicator on the map, select the Yes option. If the No option is selected, the indicator is not shown on the map.
Data Binding. Click the None hyperlink to select a slice or sheet cells range to be used to create an indicator. The Data Adapter dialog box opens.
Fill. To determine the indicator fill color, set the following attributes:
Data Binding. To determine a slice or a range of sheet cells, which will be used to select a territory to fill, click the None hyperlink. The Data Adapter dialog box opens.
Use Scale. To use the existing color set as the fill, select the No option. To use the report scale as the fill, select the Yes option, and the Colors box is replaced with the Scale box.
Scale. In the Report Scales box at the bottom part of the Map Properties dialog box select the scale existing in the report which will be used to fill.
Colors. To specify a color set to be used as the fill, click the Edit hyperlink or the default color. The Edit Indicator Colors dialog box opens.
Hatching. Set the following attributes to determine indicator hatching:
Value. To use indicator hatching, click on the empty area next to the Value attribute. Select the required hatching type in the Hatching drop-down list that appears at the bottom part of the Map Properties dialog box. To use this type, select the No option in the Dependent box.
Dependent. To set scale and slice, according to which the hatching is shown, select the Yes option.
Scale. In the Report Scales box at the bottom part of the Map Properties dialog box select the hatching scale existing in the report which will be used for hatching.
Data Binding. Select the None hyperlink to determine a slice or sheet cells range, based on which the hatching area is selected. The Data Adapter dialog box opens.
Hatching Color. Set the following attributes to determine indicator hatching color:
Data Binding. Select the None hyperlink to determine a slice or sheet cells range, based on which the hatching area is selected. The Data Adapter dialog box opens.
Use Scale. Select the No option to use the available color palette as a hatching color. To use a color set from the report scale as the hatching color, select the Yes option. The Colors box is replaced with the Scale box.
Scale. In the Report Scales box at the bottom part of the Map Properties dialog box select the scale existing in the report which will be used to fill.
Colors. To specify a color set to be used as the fill, click the Edit hyperlink or the default color. The Edit Indicator Colors dialog box opens.
Parts Width. Define the following attributes to set up indicator parts width:
Value. Specify the value, according to which the parts width is determined. To use this type, select the No value in the Dependent box.
Dependent. To define scale and slice, according to which the parts width is shown, select the Yes value.
Scale. In the Report Scales box at the bottom of the Map Properties dialog box, select a numeric scale available in the report.
Data Binding. Click the No hyperlink to indicate the slice or sheet cells range, based on which the territory is selected. The Data Adapter dialog box opens
Parts Height. Define the following attributes to set up indicator parts height:
Value. Specify the value, according to which the parts height is determined. To use this type, select the No value in the Dependent box.
Dependent. To define scale and slice, according to which the part height is shown, select the Yes value.
Scale. In the Report Scales box at the bottom of the Map Properties dialog box, select a numeric scale available in the report.
Data Binding. Click the No hyperlink to indicate the slice or sheet cells range, based on which the territory is selected. The Data Adapter dialog box opens
Maximum Number of Columns. Specify maximum number of indicator bars to show. By default, this value is set to zero (all indicator bars are shown).
Distance between Columns. Set distance between bars on the map.
Minimum Width Share. Define bar minimum width share.
Minimum Height Share. Define bar minimum height share.
Initial Rotation Angle. Set initial rotation angle.
Percent Scale. Select the Yes value to use percent scale for the bar indicator. By default, this parameter is set to No, and absolute scale is used.
NOTE. Use the Real data type to set values for the following attributes: Parts Width, Parts Height, Distance between Columns, Minimum Height Share, and Minimum Width Share. Use the Integer data type to set values for the Maximum Number of Columns and Initial Rotation Angle attributes.
See also:
Getting Started with the Reports Tool in the Web Application | Setting Up Indicators | Report Scales