On setting up layers and indicators (map, bar, pie) to show data of different slices and data obtained for different report sheets on the same map, use the Data Binding attribute available in most group attributes.
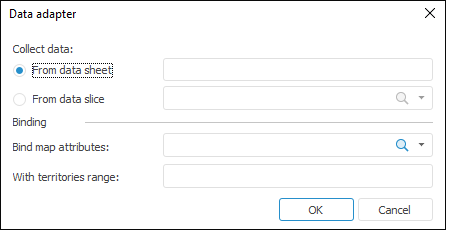
To map indicator attribute (or the map indicator) with the data, bind data source to map in the Data Adapter dialog box:

Determine the following parameters in the dialog box:
Get Data. Select a data source:
From Data Sheet. Select a sheet cell range that contains some data.
NOTE. Cells of data area, formula area and cells containing data, entered manually are available for use.
From Data Slice. Select a slice of the current report in the drop-down list.
Binding. Define binding between selected data source and the map:
Bind Map Attributes. Select a topobase attribute to create a binding with data source.
With Territories Range. Select the cells range with data. The parameter is available on selecting the data source from the sheet.
With Territories Dimension. In the drop-down list select an attribute or index of territory dimension. Available indexes and attributes, which correspond to the selected topobase attribute. The parameter is available when selecting the source from the data slice.
NOTE. For the proper work of the map select the corresponding data for binding. For example, when specifying a topobase attribute that contains territory name in the Bind Map Attributes parameter, select a cell range that contains territory name on the sheet.
See an example of data adapter setup in the Setting Up Map section.
See also:
Getting Started with the Reports Tool in the Web Application | Example of Map Setup | Setting Up Map Indicators | Setting Up Layer Attributes | Setting Up Map Indicators Attributes | Setting Up Pie Indicator Attributes | Setting Up Bar Indicator Attributes